

Inflation Misbehaving
Investors May Be Starting to Notice
Market Update
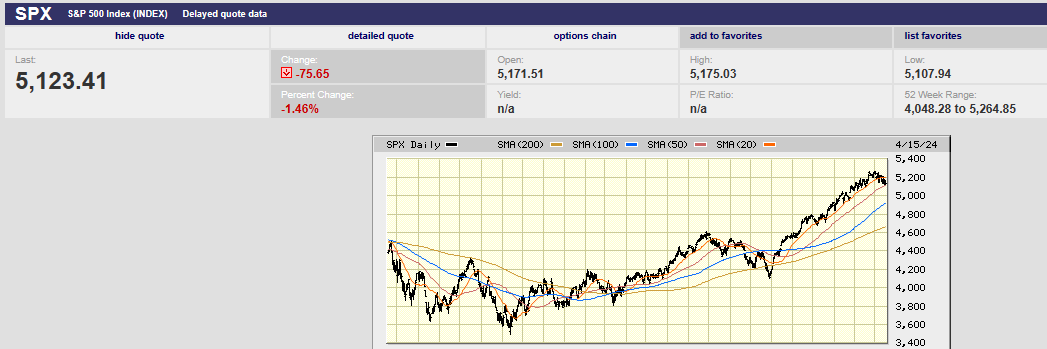
The S&P 500 fell 1.6% last week to finish at 5123.41. The index bounced off the 50-day moving average on Friday during the last hour of trading. The 50-day is around 5,107. The two-year Treasury yield ended the week at 4.93% up from 4.79% the prior week. The 10-year yield rose to 4.53%, up from 4.41% the prior week. Long-term rates continue to move higher on stronger than expected economic and inflation news. Two weeks ago, it was payrolls. Last week it was the CPI that came in hotter than expected. The 10-year yield has risen by 0.62% since early February. The 10-year Treasury yield is most closely associated with the 30-year mortgage rate.
“Inflation rises sharply again in March, CPI shows, and raises doubt about Fed rate cut,” wrote MarketWatch. The CPI rose 0.4% last month. It was the third straight month of elevated inflation readings. Economists had forecast a rise of 0.3%. The CPI has increased 3.5% over the last 12 months. That is up from 3.2%. It is the highest level since September.
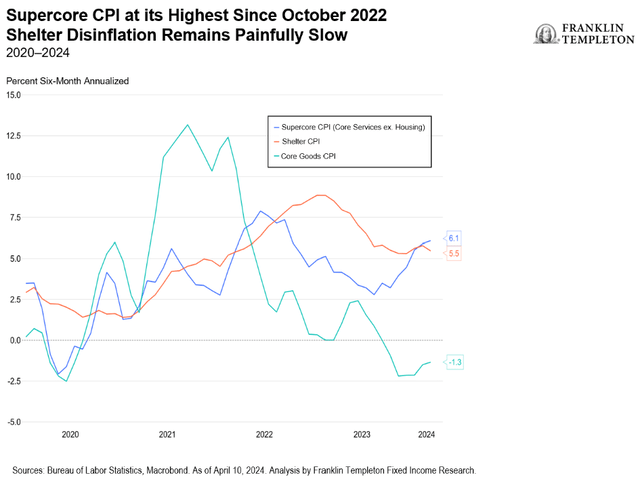
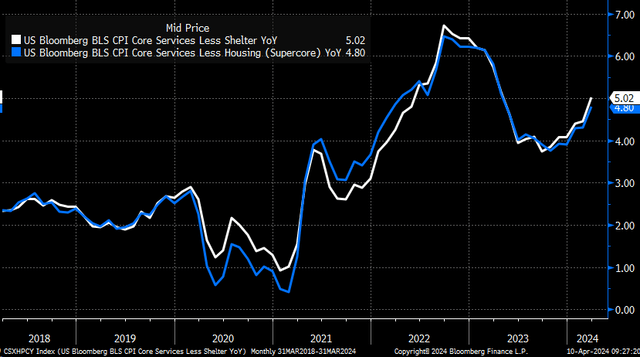
The core rate of inflation also increased 0.4% last month. The core CPI climbed to 3.8% in the 12 months ended in March, unchanged from the prior month. Strength in the core CPI number was caused by super core services (services ex energy, ex housing). Chairman Powell has pointed at the super core services number as key to bringing inflation down to the Fed’s 2% target.
Super core services rose 0.65% MoM. Medical care services jumped 0.6% MoM. Transport services increased 1.5% MoM (led by a 1.7% jump in maintenance). Vehicle insurance costs also surged. The cost of shelter rose 0.4%. Energy costs increased by 1.1% and food costs rose 0.1%. The headline inflation number also rose 0.4% MoM as a result.
Inflationary pressures may be here to stay for a while given several structural issues. Ongoing high fiscal spending is inflationary. Remilitarization of the world is inflationary. Deglobalization is inflationary. A declining population growth rate is inflationary. And the capital needs of the new green economy are also inflationary.
The selling on Friday was intense. The S&P dropped 1.5% on the day. Volatility spiked from 14.91 to 19.20 before settling at 17.31. The 29% intraday spike in volatility is a warning that investors are beginning to get nervous. The drop from 19.2 to 17.31 late in the day means it is only the first glimmering of fear. It’ll likely take more bad news on the inflation or earnings front before investors begin selling in earnest. The VIX needs to rise into the mid-30s before any kind of a decent bottom is put in place. The index has only pulled back to the 50-day moving average so far. That's less than a 3% decline. A pullback to the 100-day at 4,900 would be a 7% decline. A drop to the 200-day at 4,650 would represent an 11.7% decline. The latter would barely qualify as a correction.
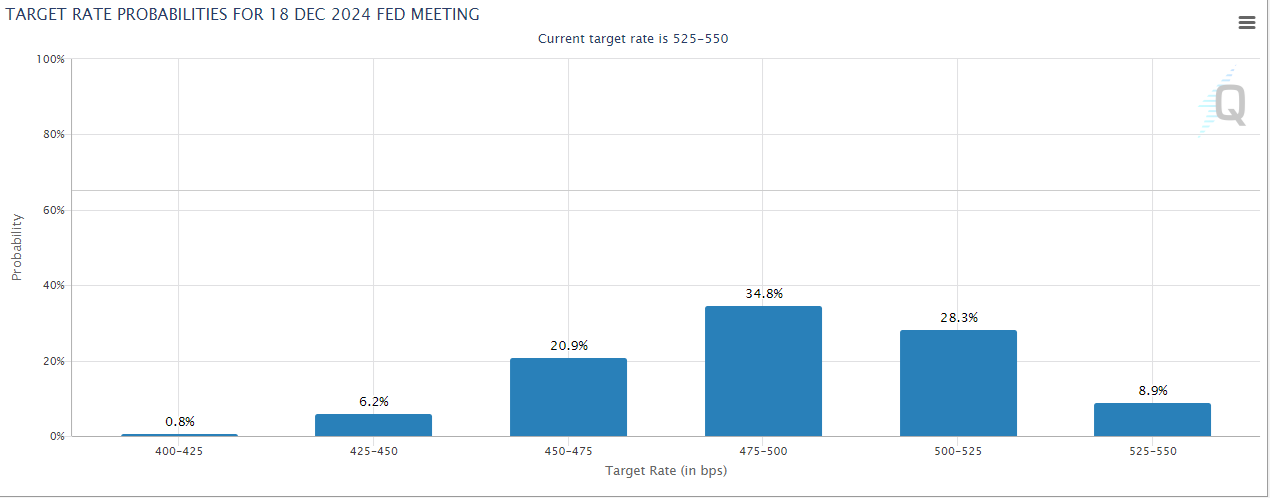
Higher for longer interest rates could serve as the catalyst for a decline to the 200-day M.A. The futures market is starting to accept higher for longer as a likely possibility. The odds of the Fed funds rate remaining at 5.25%-5.50% in June rose to 71.7% after the stronger-than-expected inflation report. The probability of a July cut to 5.00%-5.25% or less is now 55.9%. The futures market sees the probability of no cut in July at 43.5%. The CME MarketWatch tool overall is pricing in two cuts now in 2024. It was pricing in six cuts at the start of the year.
The interest rate cut narrative is falling apart. Earnings will need to come in stronger than expected if the stock market is to continue rising. The forecast is for 3.6% profit growth in the first quarter, according to FactSet. Profit growth is coming mostly from the tech sector plus two healthcare companies – Lilly and Novo. Earnings are expected to rise 9.2% in Q2 and 9.8% for the year. Profit growth is expected to reach 13.7% in 2025.
Earnings growth expectations are robust after Q1. Any disappointment is likely to trigger selling in the stock market. Uncertainty is higher than normal. Risk management remains a priority.
Economic Indicators
The big news last week was the hot CPI report. Core CPI rose 0.4% in March, the same as the prior month. Core CPI had been expected to rise 0.3%. Year-over-year core CPI rose 3.8%. As mentioned earlier super core services rose 0.65% MoM. Meanwhile PPI has moved higher in 2024. It rose 2.1% year-over-year in March, an 11-month high. Core PPI rose 2.8% year-over-year. PPI leads CPI.
The NFIB Small Business Optimism Index decreased by 0.9 of a point in March to 88.5. It is the lowest level since December 2012. “Inflation has once again been reported as the top business problem on Main Street,” according to NFIB Chief Economist Bill Dunkelberg. Twenty-five percent of owners reported that inflation was their single most important problem. At the same time owners’ plans to fill open positions continued to slow. A net 11% are planning to create jobs in the next three months.
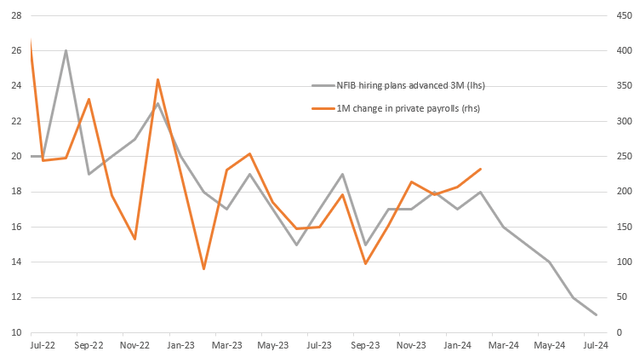
Small business owners are pessimistic. The job market may weaken in coming months.
The initial jobless claims number was 211,000 last week. That was down from 222,000 and below the forecast 217,000. The jobs market continues to show strength. Consumer sentiment fell to 77.9 in April from 79.4. The forecast had been for a 79.9 number. The latest reading is well below pre-pandemic levels although up from a year ago. Weakness in consumer and small business sentiment stands in stark contrast to the strong economic numbers.
The economy continues to grow above trend. The disinflation process appears in danger of reversing.
Core CPI rose at a three-month annualized rate of 4.5% and a six-month annualized rate of 3.9%.
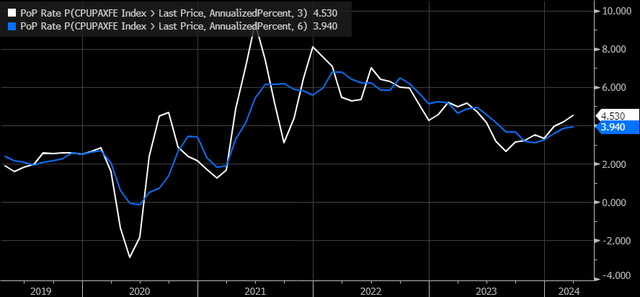
CPI supercore and core services less shelter also rose during the month, both rising by 0.7% m/m, up from 0.5% in February. This pushed the core year-over-year rate of change up to 4.8% from 4.3%, while super core service less shelter rose to 5% from 4.5%.
Fed policy for the rest of the year is uncertain.
The market hates uncertainty. Volatility is likely to rise in the coming months.
Leverage Works Both Ways
I have a friend who sells cash secured puts on stocks he is okay owning at lower prices. It’s a conservative options strategy. Yet, leverage is still involved. One contract represents 100 shares of the underlying stock. Thus, the multiplier that amplifies the price change of an option contract. A stock might trade at $50 while a put with a strike price of $45 might have a value of $2.50 ($250). It is out of the money so all the $2.50 in value represents time value. The put’s value will rise to $5 ($500) should the stock fall to $40 by expiration. The time value is zero at expiration but the put has $5 of intrinsic value. That’s because the put gives the owner the right to sell his 100 shares for $45 even though the stock is at $40. The seller of the put is out $5 ($500) minus the $2.50 ($250) collected when he sold the put. He’s lost $250 because he must buy the stock at $45 even though it is currently trading at $40.
Back to leverage. The stock will have lost 10% while the put’s value has doubled. The potential outsize gains from options are the lure. Futures also provide leverage as do a slew of different derivative products. Many people love leverage when markets are rising. Their love affair cools rapidly when markets turn hostile.
Currently there is a lot of leverage in the financial system. Margin debt has surged. Margin debt isn’t a technical indicator one can use to trade markets. It does tell us how much speculation is occurring though. It represents increased risk taking by investors in the stock market. The latest FINRA report shows a surge in margin debt. Investors are taking on more leverage to increase buying power. Margin debt supports the advance when markets are rising. Margin debt can accelerate declines though when markets are falling. A key difference is that investors often are forced to liquidate positions when the margin calls come. Forced selling can create waterfall liquidation events. Markets can fall further than they otherwise would as forced selling begets more margin calls which triggers even more selling.
The chart below shows how margin debt has grown post the Great Recession. Speculators have taken advantage of cheap money. Leverage in the financial system is high. The increased leverage in turn explains much of the advance in the S&P 500 since the Great Recession.

Regards,
Christopher R Norwood, CFA
Chief Market Strategist


