

Investors Sold the Rallies Last Week

10-day S&P 500 chart
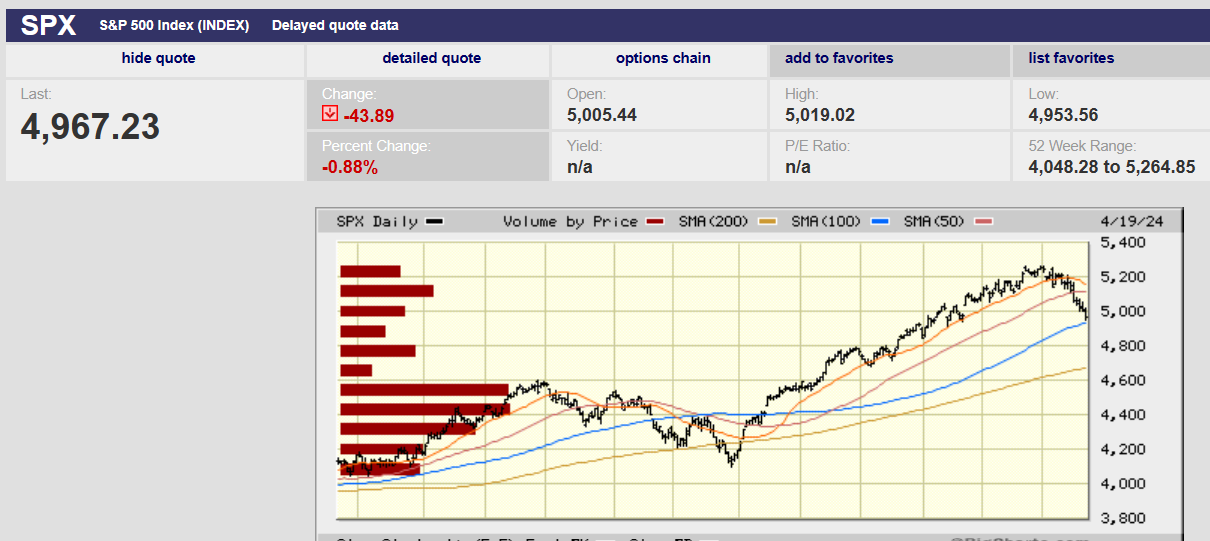
Market Update
The S&P 500 fell 3% last week to finish at 4,967.23. It was the index’s third consecutive week of declines. The S&P is down 297.62 points or 5.7% since it reached 5,264.85 on March 28th. The Nasdaq 100 fell 5.4% last week. Rallies are being sold. Early highs and late lows are a bad sign. It means investors are selling bounces instead of buying dips. Selling rallies means investors are looking to reduce stock exposure.
There is an emotional element to investing. Emotion makes accurate predictions of depth and duration hard. The S&P is back to its 100-day moving average. It may find a bottom here. The 200-day moving average is around 4,671. Perhaps the index will test the 200-day. A decline to the 200-day would be another 296 points or around 6%. The decline will have reached 11.3% by that point, qualifying as a correction. There is a negative divergence between the index and the Relative Strength Index. There is a negative divergence between the S&P and MACD also. Those negative divergences suggest more downside. The 20-day moving average is close to falling below the 50-day moving average. The selling will likely increase if the 20-day falls below the 50-day. Why? Because technicians view a cross as a negative sign, so it becomes one. The algorithms are programmed to sell and so they do.
The Nasdaq 100 has fallen below its 100-day moving average already. The 20-day is dropping below the 50-day moving average. Technology is down 7.15% over the last month as measured by the Select Sector SPDRs XLK ETF. The S&P 500 index is down 4.08% over the last month. Technology led on the way up last year and the first few months of 2024. Technology is leading on the way down now.
It's hard to say whether the decline will continue in the coming weeks. “A ‘normal’ pullback in a ‘normal’ non-recession year tests the S&P 500’s 200-day moving average,” writes Evercore strategist Julian Emanuel. Perhaps this is that normal pullback. Or the decline may be over already. There is also the possibility of something more severe.
1-year S&P 500 chart
The S&P is still expensive (as we’ve been pointing out for a while now). It is trading at around 20.4x 12-month forward earnings. The S&P has traded at 16.5x 12-month forward earnings on average since 2000 according to Barron’s. Interest rates are likely to be higher for longer than expected by investors a few short months ago. Earnings estimates are coming down. Earnings are expected to only grow 3.2% in Q1 of 2024. That’s down from double-digit growth forecast a year ago. Earnings are expected to fall 2.6% in the first quarter excluding the Magnificent Seven stocks, according to Barron’s. It would be the fifth consecutive quarterly decline.
And the bond market is waking up to the realization that higher for longer is a real possibility. The two-year Treasury hit 5% again on Thursday. It ended the week yielding 5.01%. The 10-year finished the week yielding 4.63%. Long-term interest rates were supposed to fall this year. The 10-year was yielding 3.95% at the beginning of 2024. The move to 4.63% has taken investors by surprise. Bond losses are mounting. It is the worst stretch for long-term Treasuries in 65 years on an annualized basis according to Barron’s.
The rise in yields is at least partly in response to stronger-than-expected economic data. The Atlanta Fed GDPNow forecast is projecting 2.9% growth in Q1 GDP. The Fed is calling for 2.1% growth in GDP for 2024, above the 1.8% non-inflationary rate. It wasn’t that long ago that the Fed was forecasting GDP growth for 2024 of just 1.4%. The most recent upside surprise came last week as retail sales rose more than expected in March. U.S. retail sales rose 0.7%, well above the forecast of 0.3%. Retail sales ex-autos rose 1.1% more than double the forecast of 0.5%.
Financial conditions remain loose. It might be the stock market’s saving grace, limiting the near-term downside. The Chicago Fed’s National Financial Conditions Index is as loose as it was in January 2022, according to Barron’s. The Fed didn’t start raising the funds rate until March 2022. The NFCI’s 105 market- and survey-based inputs include bank lending standards; yield spreads; debt levels; the dollar; and the level of the stock market. The Fed only controls the fed funds rate. “We can’t help but think that this massive loosening in financial conditions makes it a lot less likely that the data is going to do what the Fed is looking for in terms of weakening labor markets and lower inflation,” write Jefferies strategists.
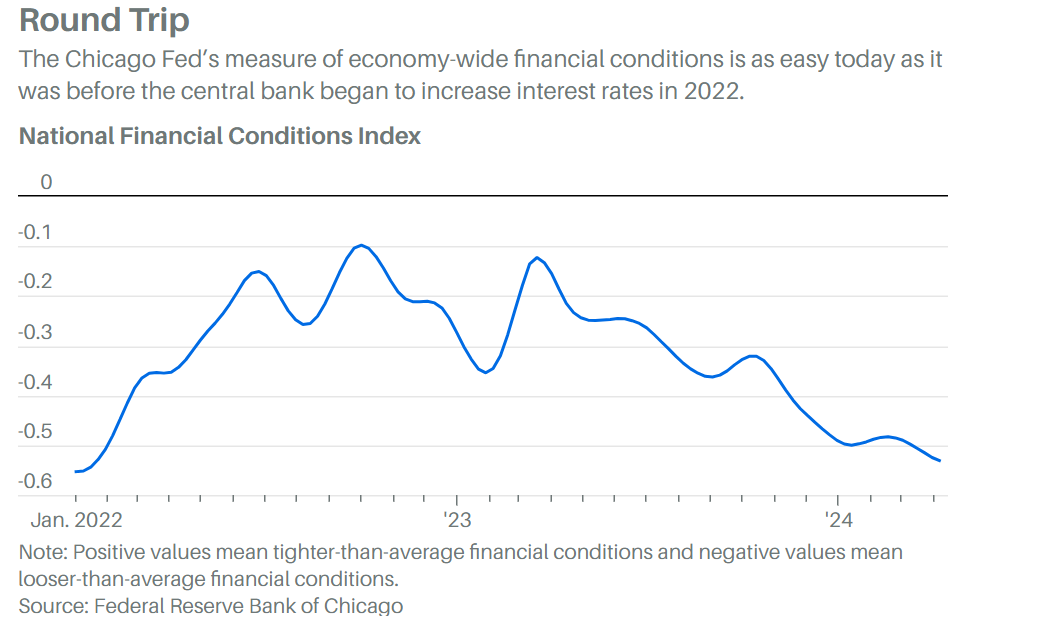
First-quarter corporate bond issuance hit a record high, according to Bloomberg, confirming loose financial conditions. “Easy financial conditions continue to provide a significant tailwind to growth and inflation,” says Torsten Sløk, chief economist at Apollo Global Management.
A strong labor market and economy should support the stock market. Loose financial conditions should support the stock market as well. Conversely, high valuations and a stock market that has rallied strongly since October could cause the market to fall further. A pullback to the 200-day moving average at approximately 4,671 would be no big surprise. It would be completely normal in fact.
Uncertainty remains high and risk management the priority.
Economic Indicators
Retail sales came in stronger than expected for March. Advance estimates of U.S. retail and food services sales rose 0.7 percent (±0.5 percent) from the previous month. Sales were up 4.0 percent (±0.5 percent) above March 2023. Please note the confidence interval. Economic data is not particularly accurate when it first comes out. Revisions eventually tell us what the economy did. Accurate numbers sometimes take months or even years to produce. The lack of timely accurate data is a major problem for a “data-dependent” Fed.
Business inventories rose 0.4% in February, up from 0.0% the prior month. Interpreting the inventory data is difficult. Intentional inventory build means businesses are optimistic, a good thing. Unintentional inventory build means demand is lagging expectations, a bad thing. Housing starts fell to 1.32 million in March from 1.55 million the prior month. Likewise, building permits fell to 1.46 million in March from 1.52 million the prior month. Existing home sales fell to 4.19 million in March from 4.38 million the prior month. The housing market is one of the most interest-rate-sensitive sectors of the economy. Rising long-term interest rates may be having an impact on the housing market.
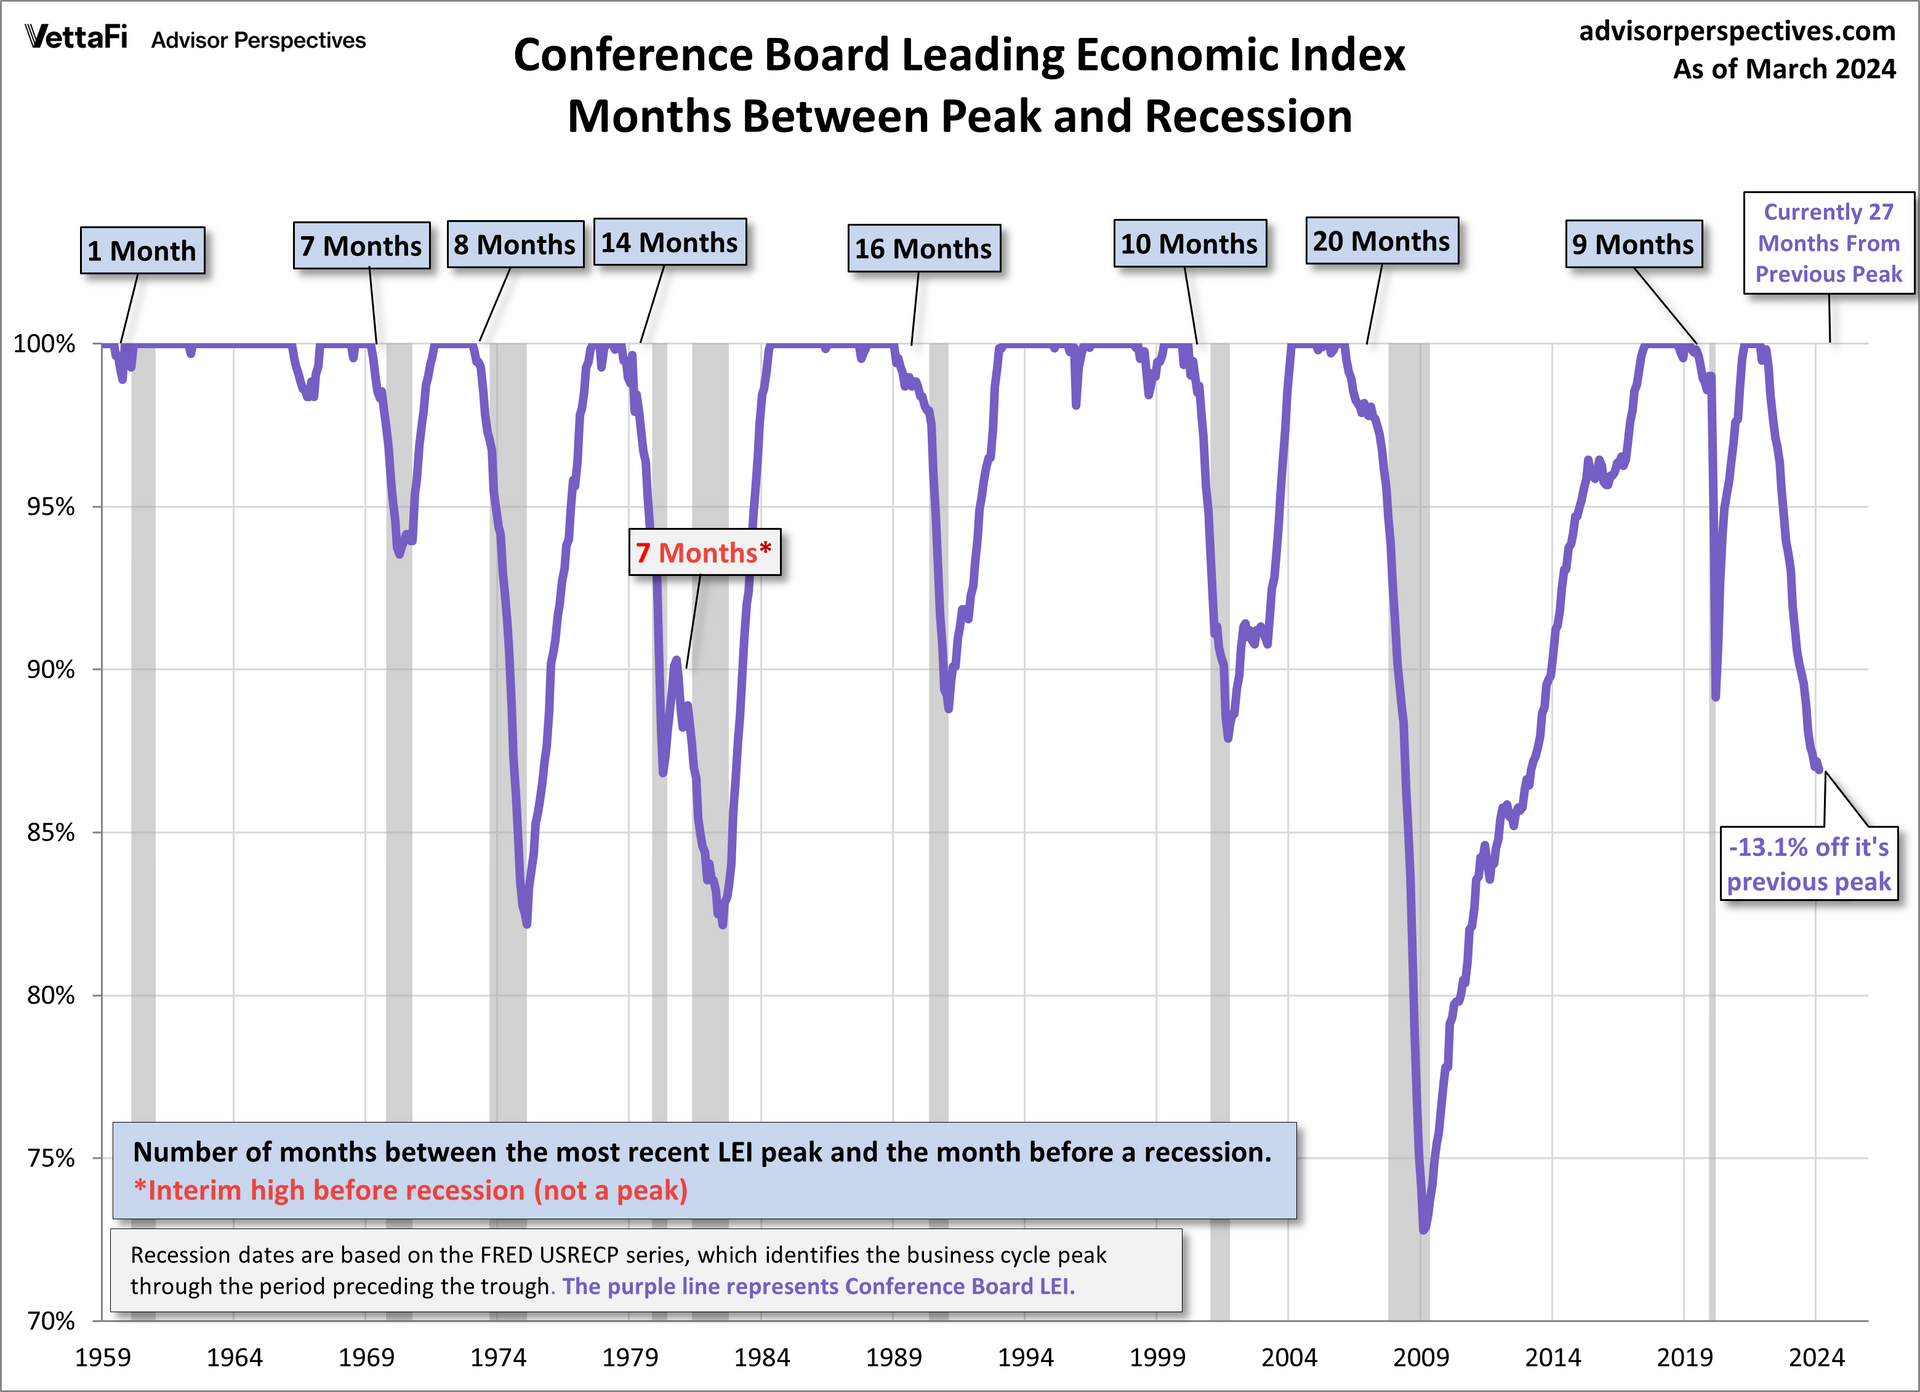
U.S. leading economic indicators fell in March, dropping 0.3% after rising 0.2% the prior month. Last month’s rise was the first in almost two years. The LEI contracted by 2.2% over the trailing six months. That was a smaller decrease than the 3.4% decline over the previous six months. Negative contributions from the yield spread, new building permits, consumers’ outlook on business conditions, new orders, and initial unemployment insurance claims drove March’s decline. The LEI points to a fragile outlook for the U.S. economy, according to the Conference Board. Rising consumer debt, elevated interest rates, and persistent inflation pressures continue to pose risks in 2024, according to the Conference Board.
The economy continues to grow, disinflation appears to be slowing. Higher for longer rates will eventually slow the economy down but there is little evidence of that happening yet.
Bonds Aren’t Always “Safe”
I had a conversation about asset allocation with someone last week. We were talking about stock/bond mixes. The classic stock/bond mix for a traditional balanced portfolio is 60/40. The 60/40 allocation has done well since the early 80s. It’s done less well over the last three years. The Vanguard Balanced Index Fund (VBIAX) has 60.77% in stocks and 37.64% in bonds. It has returned 7.66% over the last 10 years. It’s only managed 2.27% over the trailing three years though. The funds standard deviation is 10.18% over the trailing 10 years. The S&P 500 standard deviation is 15.16% over the last 10 years. Its 10-year average return is 12.33%.
Doing a little math tells us that a balanced portfolio has earned 62% of the S&P 500 return over the trailing 10-years. Investors should expect to earn less in a balanced portfolio. The tradeoff is smaller losses when the stock market does decline, or at least that's the hope. Bonds are supposed to cushion the stock losses. Bonds haven’t been doing their job lately. The iShares 20+ Year Treasury Bond ETF TLT) is down 8.96% year-to-date. It lost 31.24% in 2022. It lost 4.60% in 2021. Its three-year return is negative 11.44% per year. Its five-year return is negative 4.06%. TLT has only managed 0.32% per annum over the last 10 years and 1.91% over the last 15 years.
Bonds have been an awful asset to hold for a long time now. Surely it will change soon. Surely bonds will re-establish themselves as a safe source of income and total return. Won’t they? Perhaps, perhaps not. Bonds went through a long bear market in the 1960s and 70s. Rising inflation turned them into a money-losing investment. Treasury bonds became known as certificates of confiscation. Investors who held U.S. government bonds from 1951 to 1981 suffered losses on average.
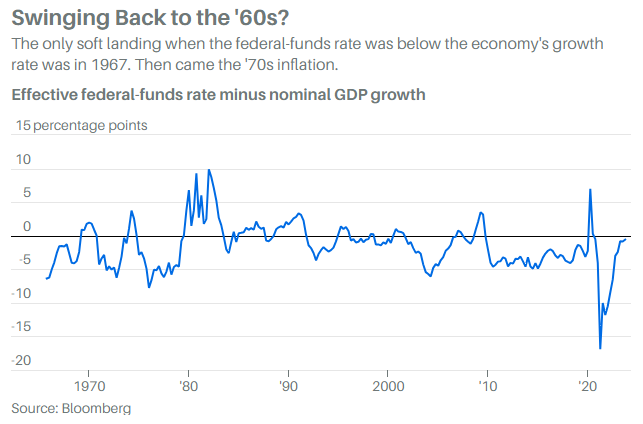
The Federal Funds Rate is still below nominal GDP. Monetary policy is still not that tight especially compared to the early 80's.
The great bond bull market began in 1982. It lasted almost forty years. It ended when the 10-year Treasury yield fell to 0.5% in 2020.
We may now be in a long bond bear market once again. The conditions are right. The U.S. government debt is around $34 trillion. The economy is only around $27 trillion. The federal government is running annual deficits of over 6%. Structural changes in the world economy make higher inflation in the coming years more likely. Bonds may well continue to suffer poor returns as a result. The general direction of interest rates may be higher over the next 10 to 20 years. Cyclical rallies would occur from time to time in a structural bond bear market. But the long-term direction for interest rates would be up in such a scenario.
The 60/40 stock/bond portfolio has been very successful since the 1980s. There is no guarantee that it will work anywhere near as well over the next decade. Bonds might not be as safe as investors have come to believe. Forty years of positive re-enforcement may need to be unlearned. Structural bond bear markets tend to last twenty years or so. We may just be getting started.
Regards,
Christopher R Norwood, CFA
Chief Market Strategist


