

Inflation isn't cooperating. GDP is better than the headline number.
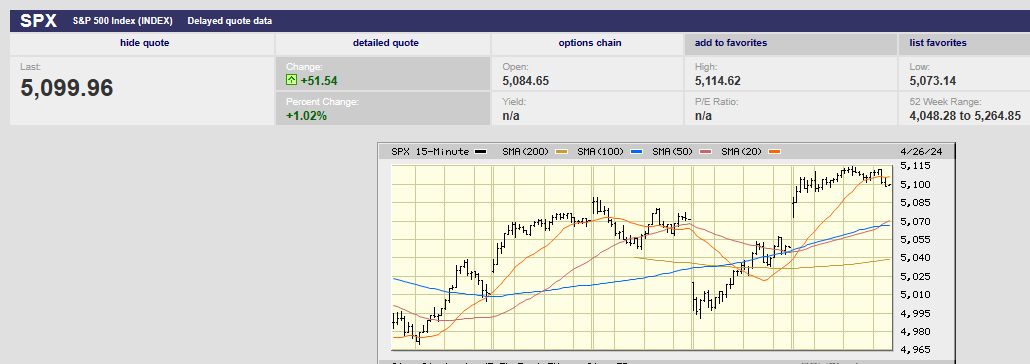
5-day S&P 500 chart
Market Update
The S&P 500 finished the week at 5,099.96, up 2.7%. The index ran into intermittent selling throughout the week though. The S&P gapped up at the open Monday morning. Selling closed the gap early. The index bottomed for the day at 11:15. It then motored higher until running into selling starting at 2:30. The S&P fell 30 points into the close to finish at 5,010. The index gapped up at the open Tuesday and Wednesday as well. Tuesday saw a slow climb higher the rest of the day. Wednesday's market ran into selling within the first 30 minutes. The index closed below its open on Wednesday, not a positive sign.
Trading the first three days of the week showed signs of an oversold rally. It was interrupted on Thursday when the GDP number for Q1 came in below expectations. Friday's PCE report restarted the contra-trend rally though. The market gapping up at the open for the fourth time in five days. The index struggled to make further progress during the rest of the day. Bull markets are characterized by slow steady accumulation throughout the day. Gap-up openings are a sign of short covering and emotional buying. Markets that gain early in the day only to run into selling are shaky markets. Trading is emotional and emotional trading often doesn’t lead to a lasting trend.
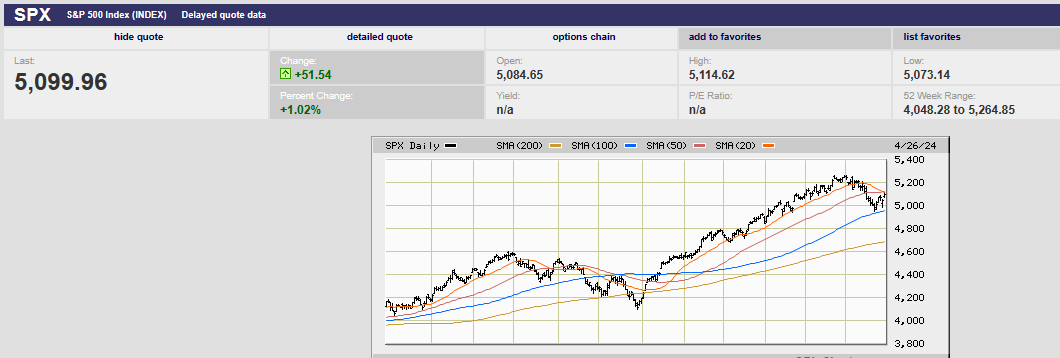
1-year S&P 500 chart
The bounce last week looks mechanical. The algorithms started buying the prior Friday at the 100-day moving average on no real news. They’ve pushed the index back to resistance at 5,100. The 20-day and 50-day moving averages at 5,100 should prove tough to overcome. The 20-day has fallen below the 50-day, which should trigger more selling pressure. Also, the stochastic oscillator is beginning to roll over. The S&P is likely to fall this week. First support is the big round 5,000 number. Second support is the 100-day moving average. The stock market is having to face the reality of higher for longer interest rates. Conditions are right for a resumption of the correction. A pullback to the 200-day moving average wouldn't be a surprise.
Earnings are the unknown. Earnings season is in full swing. The S&P is expected to grow earnings by 3.2% in Q1. The consensus is for an acceleration in earnings growth starting in Q2. The forecast is for 9.3%, 8.9%, and 14.4% earnings growth in the remaining quarters. Guidance will be critical. Disappointing guidance will make a continued pullback in the S&P likely. Confirmation of the high earnings expectations should provide support for the market. It will take better than expected guidance to push the index to new highs though.
The Economy:
First quarter GDP came in weaker than expected. The 1.6% growth was less than half the prior quarter’s 3.4% number. The forecast had been for 2.2% growth. The initial estimate is mostly estimate though and subject to revision. Also, the underlying real final sales to private domestic producers number came in at a strong 3.1%. The real final sales number excludes government spending, inventory swings, and net exports. It is the best underlying measure of what the Fed is trying to influence, argue John Ryding and Conrad DeQuadros, economic advisors to Brean Capital. In real, inflation-adjusted terms, this metric grew at an annual rate of 3.1% in the first quarter. It grew at an annual rate of 3.3% and 3.0% in the two prior quarters. The real final sales number has grown at a 5.6% nominal annual rate over the past three quarters and 6.1% in the latest quarter. “This simply cannot be seen as soft,” they write in a client note.
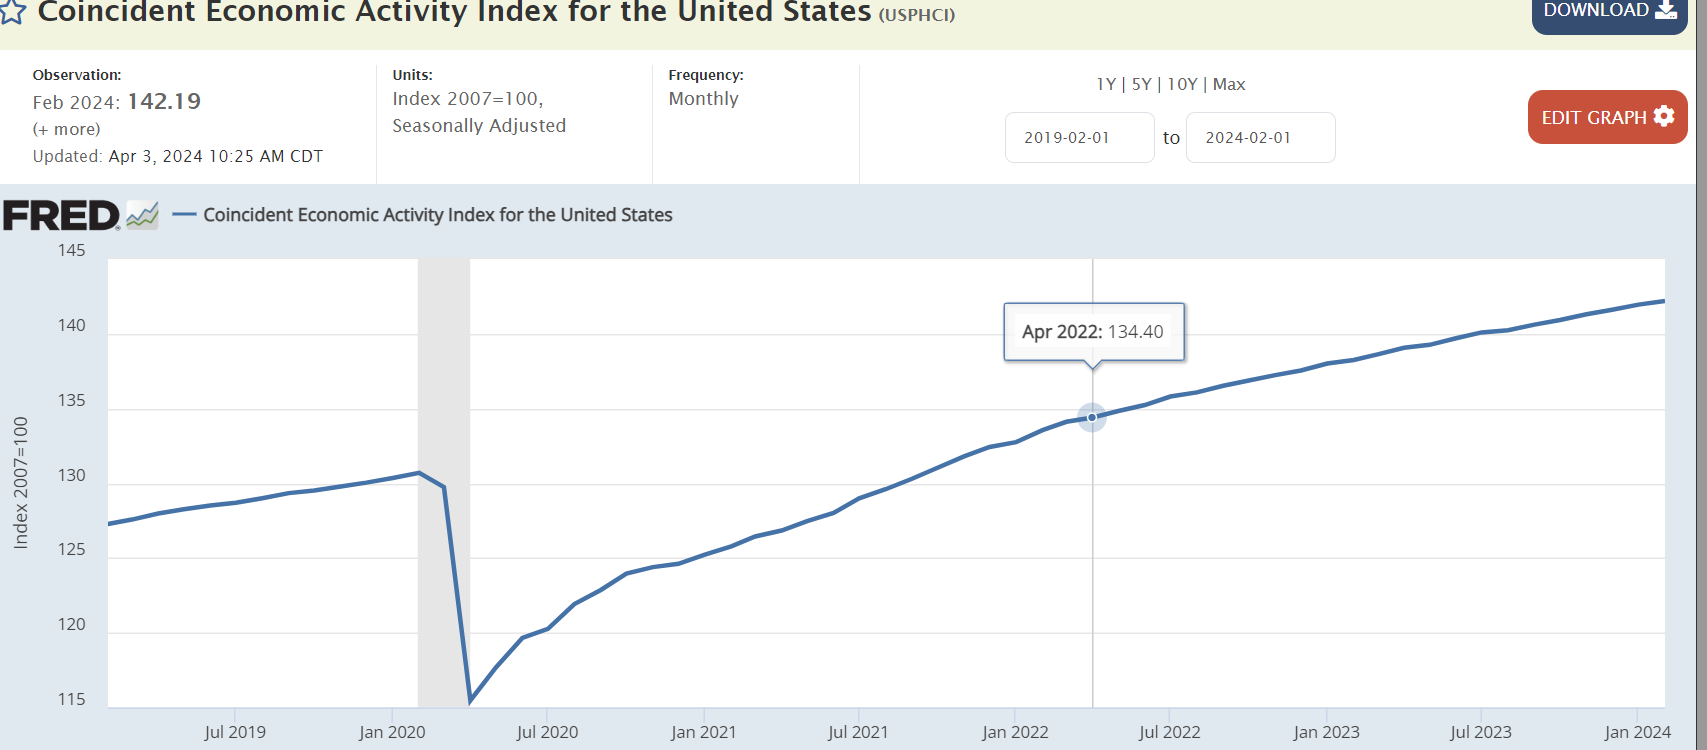
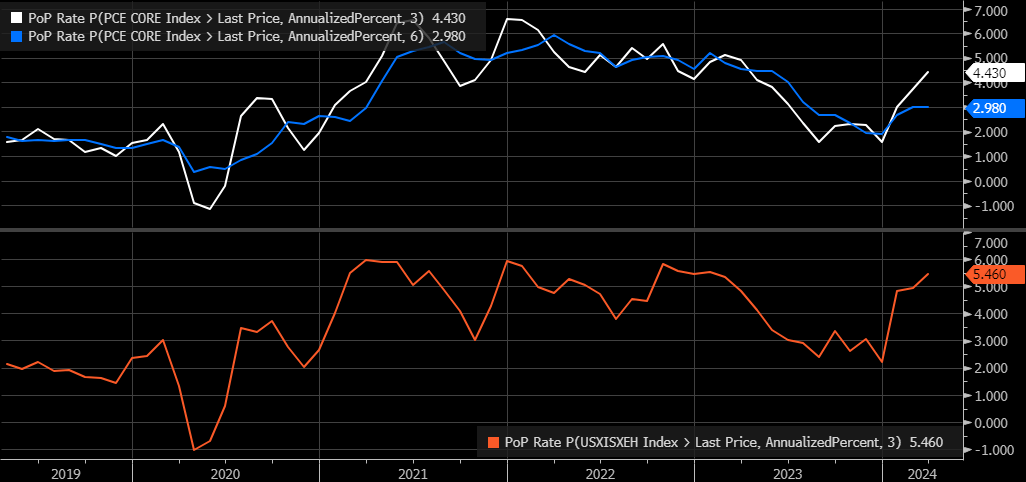
Economic growth for Q2 2024 is forecast to be 3.9% based on the Atlanta Fed GDPNow tool. The Consumer Conference Board’s Coincident Economic Indicators Index shows no signs of weakening. It rose by 0.3% in March to 112.0. It increased by 0.1% in February. The CEI rose by 0.6% over the six-month period ending in March. Meanwhile, inflation is perking up. The core personal consumption expenditures index rose 0.3% in March. The core number excludes food and energy costs. The year-over-year rate is running at 2.8%. But core PCE rose at a 4.5% annual rate over the most recent three months, according to Michael Lewis, head of the Free Market advisory. “More PCE reports like this and rate hikes will be on the table,” he wrote after the most recent inflation report.
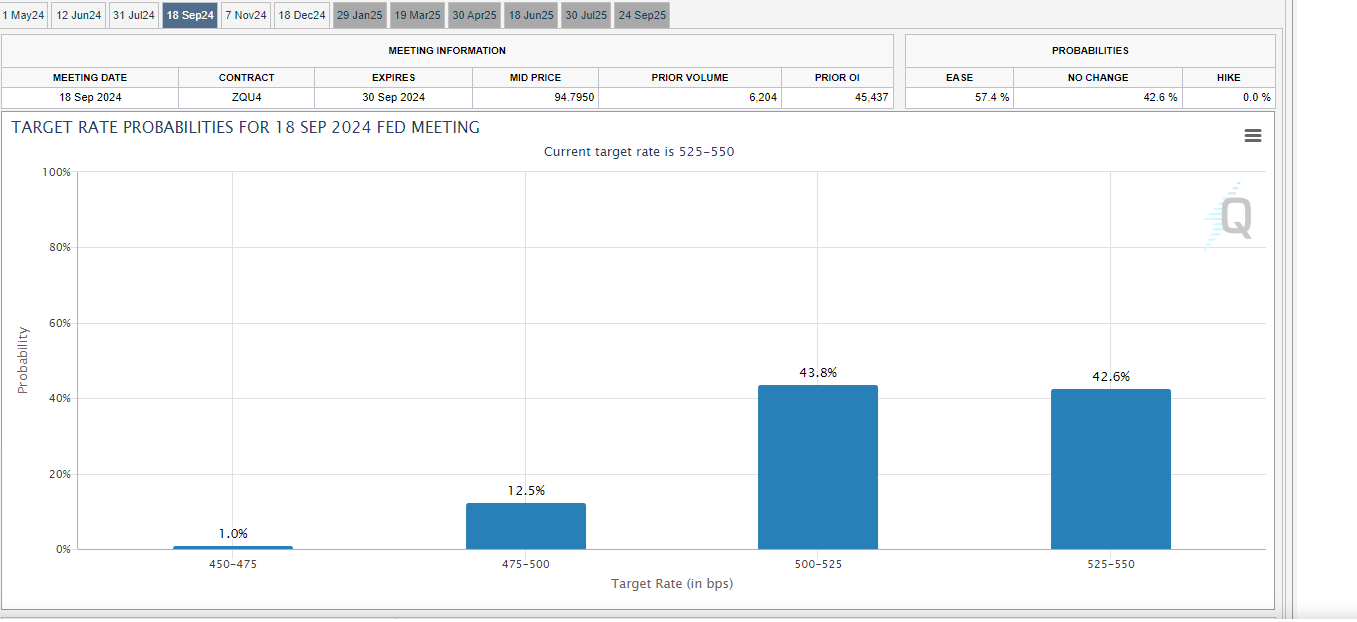
The Fed can’t justify rates cuts yet. The bond market is acknowledging as much. The CME FedWatch Tool is pricing in a single rate cut by year end. The probability that the Fed will stand pat in May, June, and July is high. The first and only rate cut for the year is likely to happen in September or November. Even then the probability of a cut barely exceeds the probability of maintaining the current funds rate. The Fed needs to see a slowing economy, rising unemployment and a falling core PCE number. It can't creditably cut rates without data to support the move. Of course, it’s hard to imagine that earnings forecasts won’t take a hit in such an environment. Higher for longer interest rates will be a problem for the stock market. Rate cuts triggered by a weakening economy will also be a problem for the stock market.
Economic Indicators
The U.S. economy lost momentum in April a pair of S&P surveys found. Businesses reported a decline in new orders and reduced employment for the first time since the pandemic. The flash U.S. manufacturing purchasing managers index slipped to a four-month low of 49.9 in April from 51.9 in March. The service’s PMI fell to 50.9 in April from 51.7. The forecast had been for 52.0.
The housing market showed signs of life. New home sales in March rose to 693,000 from 637,000 the prior month. The forecast of 669,000 was easily exceeded. Pending home sales also came in better than expected. Home sales rose 3.4% in March against 1.6% the prior month. The forecast had been for a flat number.
Personal income rose 0.5% in March, meeting expectations, and better than the prior month’s 0.3% gain. Personal spending remained strong, rising 0.8%. That was despite consumer sentiment weakening in late April, according to the University of Michigan survey. Inflation is on people’s minds. The sentiment survey shows that Americans believe inflation will average 3.2% in the next year. That is the highest rate since November 2023. The Fed pays attention to inflation expectations because they can become self-fulfilling. Inflation expectations may be less well anchored given the rising Michigan number.

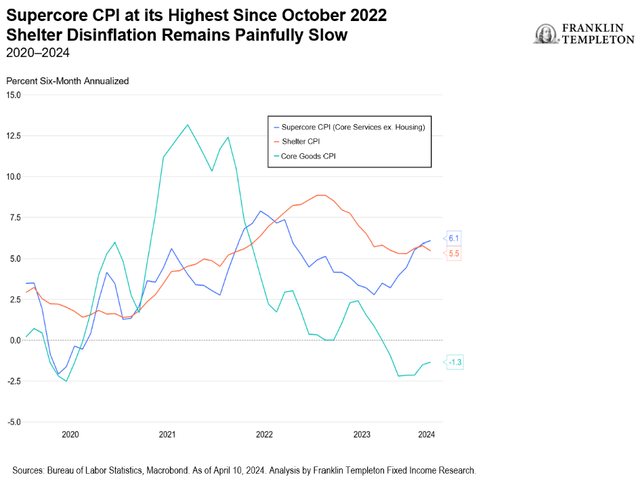
Inflation expectations may be rising for a good reason. Super core inflation isn’t behaving. It rose 0.4% in March, double the prior month’s reading. The measure strips out housing and energy from service prices to isolate labor costs. Labor is the biggest expense for most businesses. The annual increase in super core inflation in the past three months was 5.5% in March, up from 4.9% in February and 2.2% in December. “Inflation remains at the forefront of economic concerns as the stronger hiring and spending in early 2024 has also reignited inflation," said Nationwide senior economist Ben Ayers. The cost of services has risen 4% over the past year. Service inflation was averaging 2.2% a year before the pandemic.
Economic data out last week provided no cover for a Fed rate cut.
Tracking Error
I had a nice conversation last week with a client about portfolio returns and benchmarks. Mutual fund managers are mostly relative return managers. A benchmark is their bogey. A U.S. large cap stock portfolio manager must stay up with the S&P 500 or Russell 1000 for example. Their benchmark is their default portfolio. Technology makes up 28.15% of the S&P 500. A U.S. large cap stock portfolio manager whose benchmark is the S&P 500 has a neutral position of 28.15% in technology. Deviating from that weighting means assuming relative performance risk. The manager is allowing tracking error. Tracking error can lead to under performance.
Microsoft is 7.09% of the S&P 500 index. Apple is 5.64%. Nvidia is 5.06%. Deviating from those weightings means assuming relative performance risk. A manager is said to be “short” Microsoft if they are underweighting the index amount. Dropping Microsoft to 5% of the portfolio is a bold move indeed. The manager runs the risk of underperforming the index which could lead to them losing their job. In turn, the mutual fund company is taking on business risk if it allows the portfolio manager too much leeway in assuming tracking error.
Tracking error isn’t about what is best for the investor. It is about what is best for the mutual fund company and the portfolio manager. Keep returns close to the benchmark by imitating the benchmark. Allow just enough tracking error into the portfolio to beat the benchmark after fees. (50 years of data shows that mutual fund managers have failed at adding risk adjusted return with this approach).
Norwood Economics currently owns 28 stocks in client portfolios. We own 14 U.S. companies and 14 International companies. Most clients own most of the stocks. Our tracking error is huge. And we don’t care. Our job is to attempt to earn excess risk-adjusted return not to beat an index. Our job is to earn a real portfolio return that allows our clients to meet their spending goals in retirement. That is the only goal that matters. Does our huge tracking error lead to some tense conversations from time to time with clients? Yes. Do most of our clients come around to our way of thinking after we’ve talked? Also, yes. It can be hard to let go of the relative performance tracking error train of thought. The mutual fund industry has pounded relative performance into investors heads. They’ve done so because they’re trying to attract more money to earn more fees. Humans are competitive by nature. We also have issues with performance envy. Mutual fund companies take advantage of those very human characteristics with their marketing.
Earning a real rate of return that allows you to meet your spending goals is the goal. Building an appropriate diversified portfolio gives you the highest probability of earning the needed real rate of return. Owning inexpensive, dividend paying stocks has proven to be a successful strategy over the long run.
On the other hand, worrying about what the S&P 500 is doing is a distraction that investors could do without.
Regards,
Christopher R Norwood, CFA
Chief Market Strategist


