This is a subtitle for your new post

Executive Summary
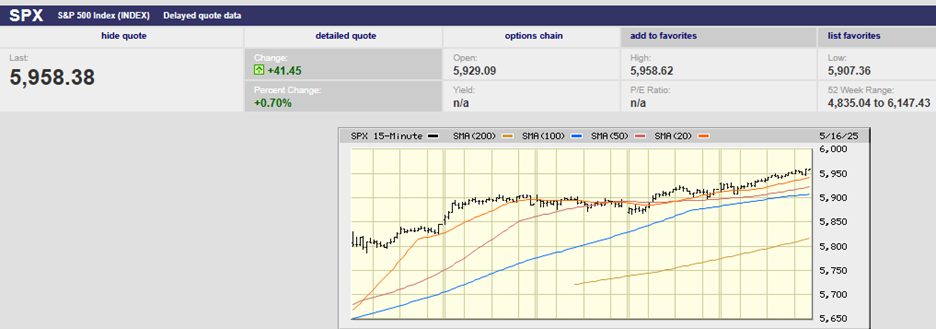
- The S&P 500 fell 3.1% last week to finish at 5,770.20
- The S&P closed 50 points above the 200-day moving average on Friday
- A bearish crossover or a “dark cross” indicates a loss of momentum
- A correction of 10% or more is increasingly likely
- Founder of AQR, Cliff Asness makes some important observations
- Interesting Charts below
The Stock Market
The S&P 500 fell 3.1% last week to finish at 5,770.20, its worst week since September. The S&P is down 1.9% for the year. Technology (XLK) is down 6.01% year-to-date. Consumer discretionary (XLY) is down 8.33%. The other nine S&P sectors are up on the year, led by Health Care (XLV), which is up 8.51%. Consumer Staples (XLP) is the next best-performing sector, up 5.41%. The 10-year Treasury Yield rose to 4.31% from 4.21% last week. The two-year yield was unchanged at 4.01%.
S&P 500 5-Day Chart
We wrote last week that, “We might see some early selling on Monday. The trend in the first few days of trading this week is more likely up than down though.” It turned out that the S&P held the 100-day for the first few hours of trading Monday. The index had closed right at the 100-day moving average the Friday before. Investors gapped the market up above the 100-day at the open. The index fell below the 100-day around 1 p.m. The selling didn’t stop until around 11 a.m. on Tuesday. The next support was the 200-day at 5,710.
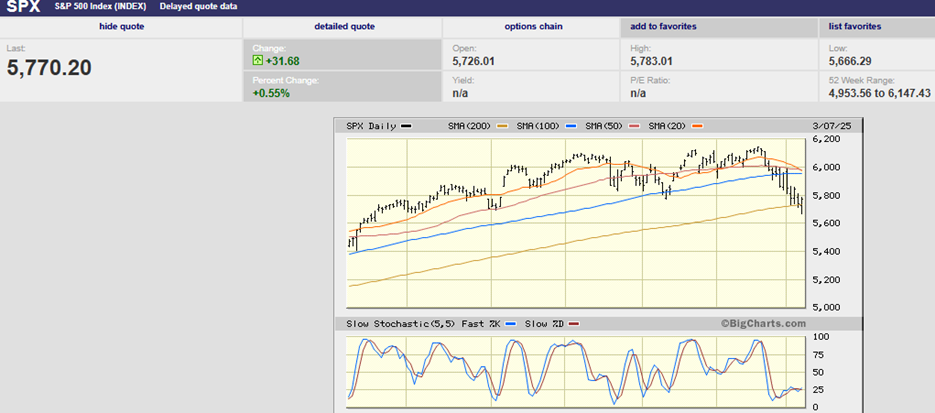
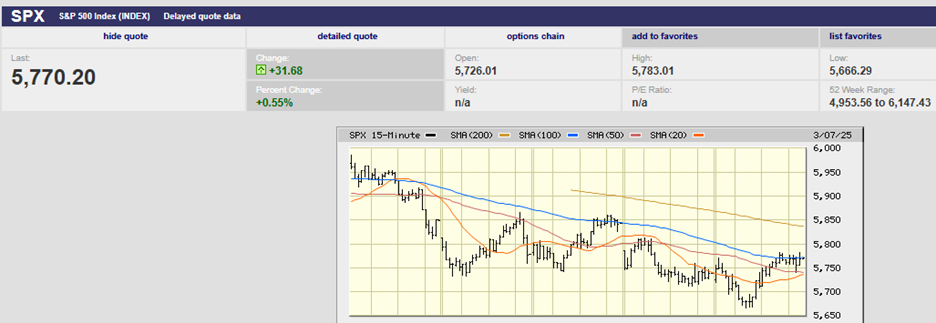
S&P 500 6-Month Chart
The S&P held the 200-day moving average on Tuesday and Wednesday (see chart above). It slipped below the 200-day Thursday but climbed back above by the close. Friday saw a clear breach of the 200-day after the index gapped down below the 200-day at the open. Traders rallied the index back above after hitting a low of 5,666.29 around noon. The S&P closed 50 points above the 200-day on Friday.
“... the S&P 500 hovers right around its key 200-day moving average at about 5700,” Evercore ISI’s equity strategists wrote in a Friday note. “This coming week will be a huge test of Trump’s attitude toward the market, with 25% tariffs on steel and aluminum to hit March 12, followed by a possible government shutdown on March 14," Evercore added.
The S&P 500 hasn’t been below its 200-day moving average since the fall of 2023. The 200-day is the main trend line for a market or stock. Also, the 20-day is falling below the 50-day. It’s known as a bearish crossover or a “dark cross”. The dark cross indicates a loss of momentum. Traders pay attention to such things. A dark cross means a downtrend may be developing. Traders (and their algorithms) often use the cross as a signal to stop buying and start selling. The cross can become a self-fulfilling prophecy. It's far from foolproof as an indicator of near-term market direction though.
What is certain is that the S&P 500 is below where it was in mid-October of 2024. The index has been trading sideways for over four months. Less certain is whether a short-term (or long-term) top is in place. That will depend on whether the economy and corporate earnings deteriorate. Mind you, the S&P 500 is capable of falling 20% or more without a recession. “The stock market has predicted nine of the last five recessions,” Nobel Laurette Paul Samuelson famously quipped.
Not that the S&P decline is anywhere near the 20% drop associated with a bear market. It hasn’t even met the definition of a correction – a drop of 10% or more. The index is down 6.1% from its high. It has fallen as much as 7.8%. The Nasdaq 100 entered correction territory on Friday. It bounced, beginning around noon, and avoided closing in correction territory.
We may or may not enter correction territory in the coming weeks. What is certain is that the concentrated market of 2023/24 is a thing of the past, at least for now. Randall W. Forsyth wrote the following in this week’s Barron’s: “The highest-conviction trades coming into 2025—buy U.S. exceptionalism and the Mag 7, avoid the rest of the world, sell bonds—have been turned on their head. Chinese and German stocks are up by double digits since Jan. 20, while the U.S.—and notably information tech and consumer-discretionary stocks—is down since then.”
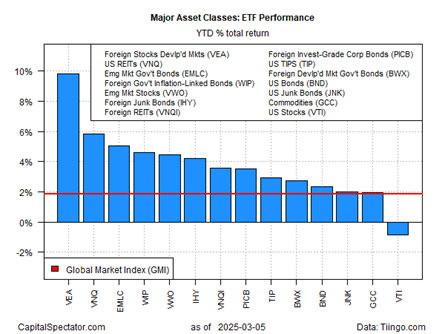
Foreign stocks are leading the way so far in 2025. The Vanguard FTSE Developed Markets ETF (VEA) is up 9.8% through Thursday. The Vanguard Total US Stock Market Index Fund ETF (VTI) was down 0.9% through Thursday. The U.S. real estate investment trusts (VNQ) was second best in 2025 up 5.9% through Thursday. Emerging market stocks (VWO) are up 4.36% year-to-date. Meanwhile, the Mag 7 stocks are down around 16% on average from their highs.
“The sight of US stocks falling to the back of the line and posting the only loss year to date among global markets highlights a dramatic shift in leadership,” James Picerno of The Milwaukee Co. wrote last week. “President Trump’s trade war has roiled markets, unleashing a surge of uncertainty about the macro implications.”, he added.
“Ironically, in a year [where] everyone said America First, other markets, including emerging markets and Europe, might outperform,” said David Hauner, global head of emerging markets and FX strategy at BofA. “We may be at the beginning of a bigger shift here.”
Whether it is a bigger sustained shift will depend in part on whether the U.S. economy continues to grow. Initial jobless claims were better than expected. There were 221,000 new claims against an estimate of 235,000. Initial jobless claims fell from 242,000 the prior month. The US economy added 151,000 jobs in February. It was below expectations, but not by much. Private sector gains offset federal job losses for the most part. Unemployment rose to 4.1%.
The job market still appears solid.
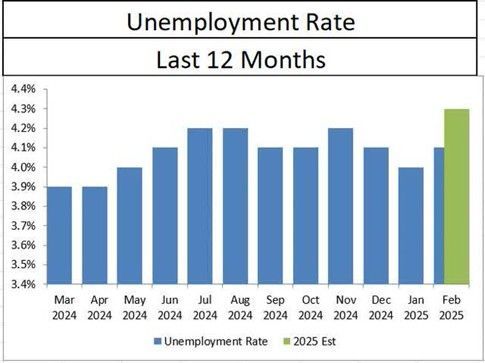
The unemployment rate at 4.1% is below the Fed’s estimate for 2025.
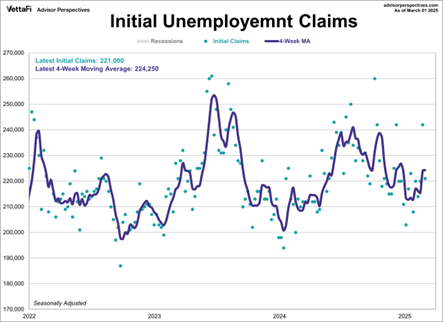
Initial unemployment claims are holding steady at a low level.
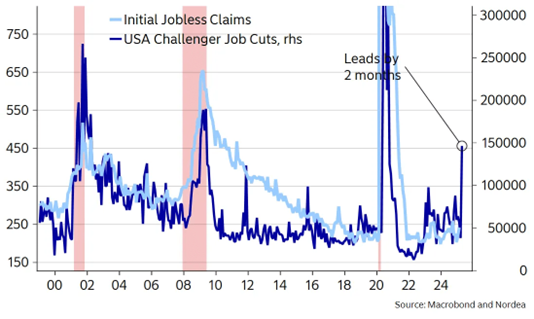
But for how much longer?
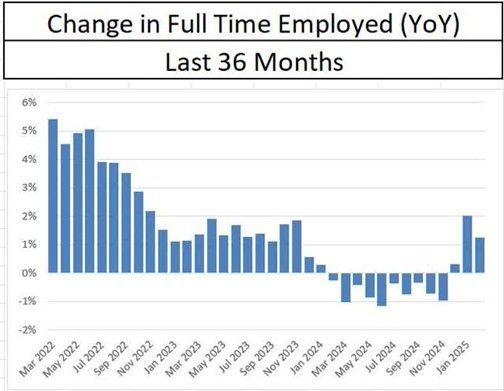
Full-time employment is rising once again for now.

The Atlanta Fed GDPNow forecast is estimating GDP growth in Q1 of negative 2.4%, up from negative 2.8%. The Atlanta Fed’s GDPNow model is worrisome despite the improvement.
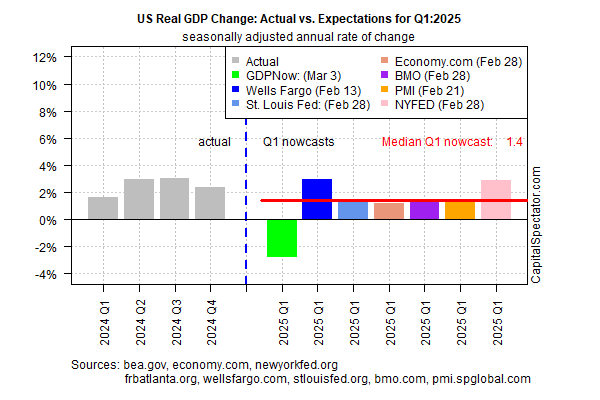
The Atlanta Fed’s GDPNow Estimate may be an outlier. It's the most recent though, which means other estimates may worsen when next updated (chart above)
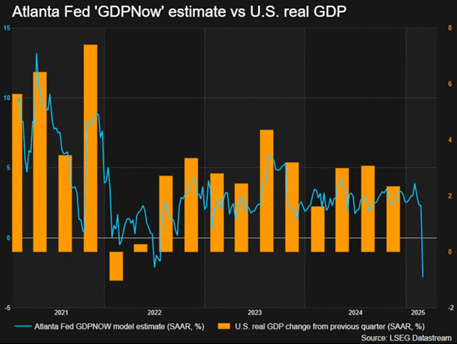
The Atlanta Fed’s GDPNow forecast is correlated to U.S. real GDP growth.
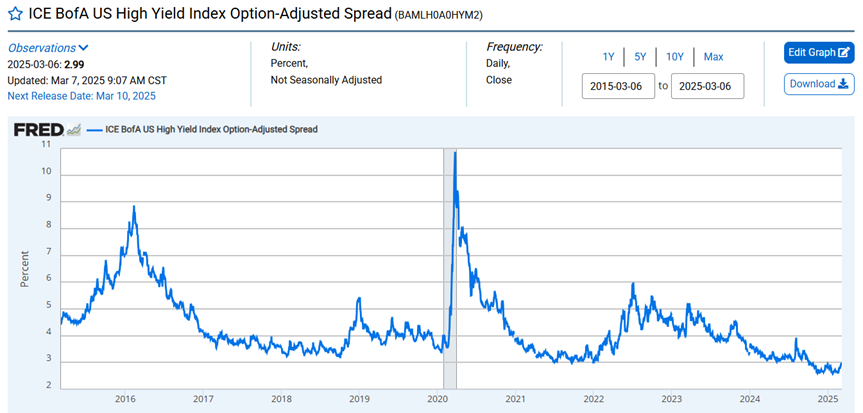
Credit spreads are an early warning indicator. The credit spread has risen in recent weeks. It is too early to tell whether spreads will continue to widen. It's also too early to tell if the pullback will become a correction, although the odds are increasing. The VIX (fear gauge) hasn't broken above 30 yet. It hit 26.56 on Friday. Often it takes a number in the mid-30s or higher before a short-term bottom is put in place. Tariffs are the alpha and omega right now. A continuation of the trade war makes a correction likely. It also opens up the possibility of a bear market, whether a recession follows or not. The next support is around 5,600 then 5,400.
All eyes on Trump for now.
Investing Foibles
Cliff Asness founder of AQR was interviewed in Barron’s this week. He made some important observations. “…the ‘grandparent of all mistakes’—having too short a time horizon. Investors can have a momentum orientation at a value time horizon,” Asness says. “Momentum seems to be quite powerful over three to 12 months. Value works over five years. A lot of investors look at that five-year horizon and go in the direction of what has worked. They are investing as momentum investors for a horizon where it is smarter to be a contrarian investor.” Translation: investors chase performance, afraid of being left behind in the short term. A five-year time horizon requires buying what is out of favor. It requires patience. A contrarian investor must be able to ignore the performance-chasing crowd. They must wait for the market to recognize value.
Another Asness observation: “Don’t mistake a valuation change for truth.” Asness is talking about an increase in the price-to-earnings ratio. Long-run returns are the sum of a stock's earnings yield and earnings growth. A winning stock whose P/E ratio has gone from 10 to 25 has had a hell of a run. But earnings haven't kept up with the price. The stock won’t perform as well in the future. It may well give some gains back. That means Nvidia is unlikely to be the darling everyone wants to own a decade from now.
Another mistake is to focus too much on the wrong thing, according to Asness. “I’ve been on a lot of investment committees, and we’ll spend all our time on the three losers in the portfolio. I’ll ask, ‘Can we also examine the two or three biggest winners?’ Because that’s anomalous and often can reverse.” That last part is important. “Anomalous” and “reverse” mean that big gains in a stock aren’t sustainable. Remember that long-term gains are the sum of earnings yield and earnings growth. P/E ratio expansions and contractions are temporary. Chase those winners at your peril.
Interesting Charts
The question is why?
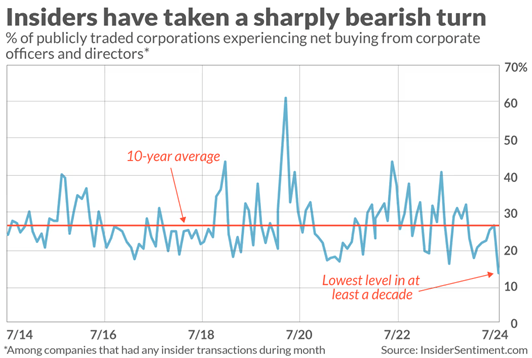
Why aren’t insiders buying?
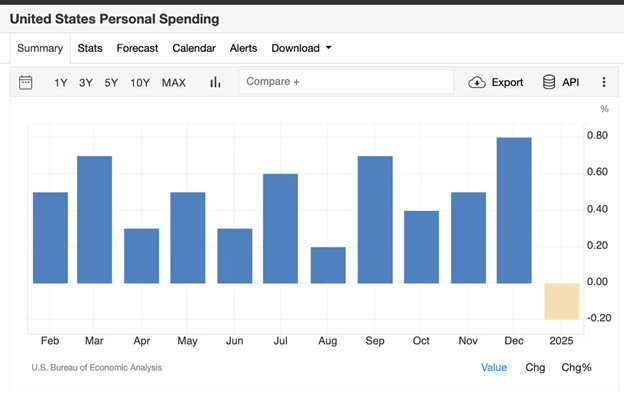
Is it the start of a consumer pullback? A lack of confidence can have that effect.
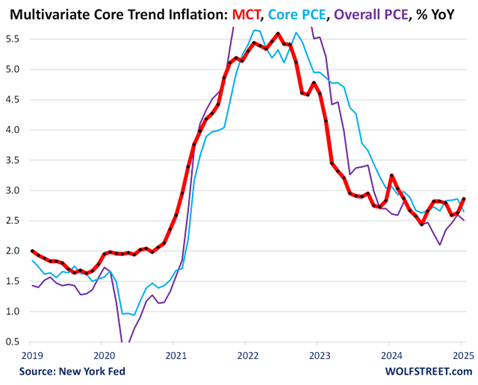
The YoY MCT* accelerated to 2.86% in January, from 2.63% in December, the worst increase since March 2024.
*Multivariate Core Trend inflation. The New York Fed came out with a new inflation measure. It's based on the data in the PCE price index and tries to show inflation's "persistence."
Regards,
Christopher R Norwood, CFA
Chief Market Strategist