Executive Summary
• The S&P 500 fell 2.3% last week to finish at 5,638.94
• The S&P is down 4.13% year-to-date
• The Nasdaq fell into correction territory and is down 11.6% since mid-February
• Market strategists are saying recession risk is rising
• Tariffs hurt the economy
• Consumers and small business owners are feeling the pinch
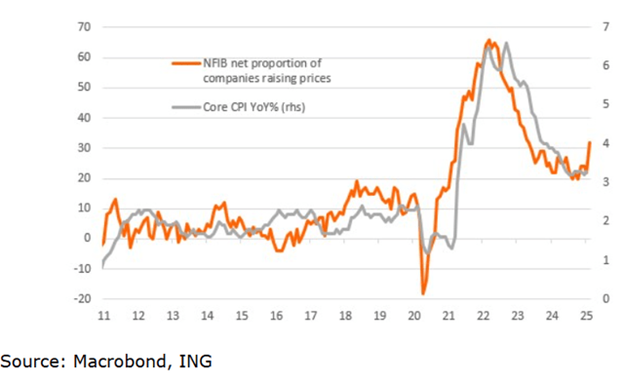
• The NFIB Uncertainty Index rose to its second-highest level ever in February
• The Trump administration is targeting a lower 10-year Treasury Yield
• Interesting Charts below
The Stock Market
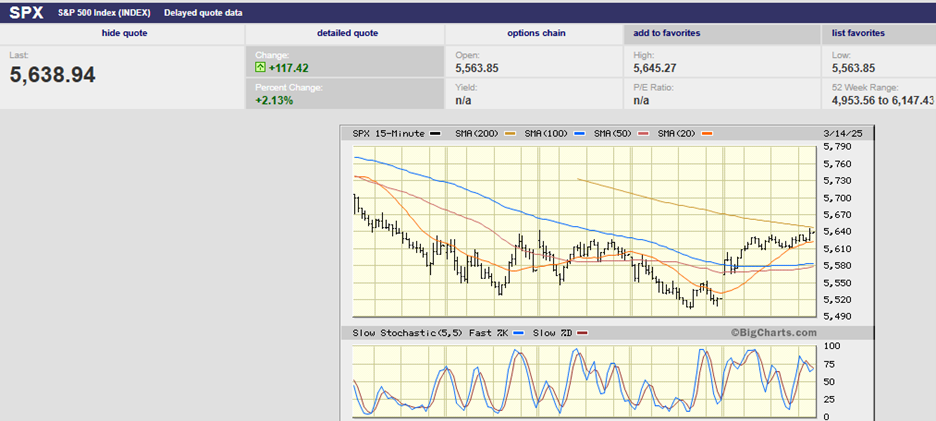
S&P 500 5-Day Chart
The S&P 500 fell 2.3% last week to finish at 5,638.94. The index bounced 2.13% on Friday keeping last week’s loss from being worse. The S&P was down over 10% at its lows last week. It is down 508.49 points since setting a record high in mid-February. The 8.3% loss has been orderly with no signs of panic by investors. The Volatility Index (VIX) hasn’t even reached 30 yet although it came close last week. The VIX peaked just shy of 30 on Monday and again on Tuesday. A VIX in the mid-30s or higher is usually a sign of at least a short-term bottom. The S&P is down 4.13% year-to-date.
The Nasdaq fell into correction territory a week ago Friday. The Nasdaq 100 (QQQ) is down 6.18% year-to-date. It is down 11.6% since hitting a record high in mid-February. According to Barron's, the Mag 7 contributed more than half of the S&P’s gain of 23% in 2024. Those seven stocks rose an average of 60% last year. The Mag 7 stocks are down an average of 15% as of Friday. According to Barron's, they’ve accounted for about 95% of the index’s decline of 6% in 2025.
The S&P is attempting to bounce. A three-day bottom was in place going into Thursday’s trading. The Tuesday low had held on Wednesday giving traders hope that a bounce was in the offing. Trump’s latest tariff threats sank the S&P 500 instead, according to CNBC among others. The index hit a new low for the downtrend and closed Thursday down 10.1% from its February high. The Thursday low did hold on Friday. The S&P set the low for the day early Friday and the high for the day late. The S&P is primed to bounce this week, likely at least back to the 200-day moving average residing at 5,740. The next resistance is around 5,800. There is stiff resistance in the 5,900 – 6,100 range, which was the market’s trading range for the last four-plus months.
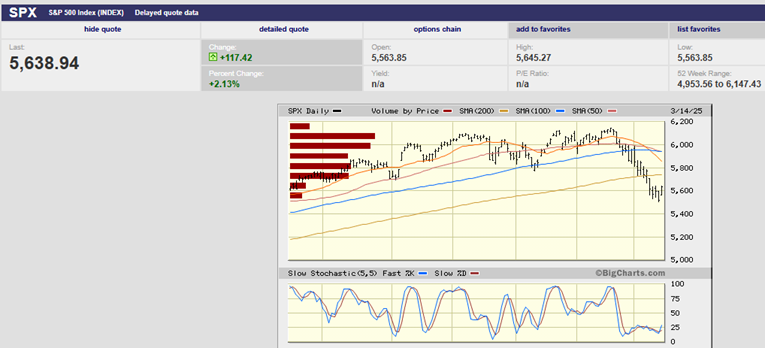
S&P 500 6-Month Chart
The 20-day moving average has fallen below both the 50 and 100-day moving averages. The 50-day M.A. is falling below the 100-day currently. The 200-day M.A. is the main trend, and it is flattening. With a four-month top in place and a flattening 200-day, the risk of a bigger pullback is increasing. Traders get nervous when market momentum stalls. They start thinking about locking in profits. The clock is ticking as momentum continues to wane.
The fundamentals are deteriorating right along with the technicals. Goldman Sachs on Monday downgraded its 2025 projection for U.S. economic growth to 1.7% from 2.4%. Goldman cited its outlook on the Trump administration's trade policy for the cut, chief economist Jan Hatzius said in a research note. “We now see the average US tariff rate rising by 10pp this year, twice our previous forecast and about five times the increase seen in the first Trump administration,” he said. "The new GDP forecast is the first below-consensus projection in two-and-a-half years," Hatzius said. The Bloomberg consensus was at 2%, according to Barron’s. J.P. Morgan chimed in last week as well. “Tariffs on Canada, Mexico, and China could raise core personal- consumption-expenditure inflation by one percentage point and cut growth by a half to one percentage point,” J.P. Morgan analysts wrote in a note to clients.
“Just a couple of weeks ago we were getting questions about whether we think the US economy is re-accelerating —- and now all of a sudden the R word is being brought up repeatedly,” said Gennadiy Goldberg, head of US interest rate strategy at TD Securities. “The market’s gone from exuberance about growth to absolute despair," he added. Economists see trouble brewing in the months ahead. A Reuters poll last week found 91% of economists view the odds of a downturn to have increased. They cited Trump’s rapidly shifting trade policies as the primary reason. “Given this is so uncertain and that there are new announcements every hour or so, it’s kind of unclear what the environment is going to look like. It’s hard to deny the risk of a recession has intensified,” said Jonathan Millar, senior U.S. economist at Barclays in New York.
Mohamed El-Erian, former CEO of PIMCO puts the chances of recession this year at 25% to 30%. Former Treasury Secretary and well-known economist Lawrence Summers sees a 50% chance of recession this year. JPMorgan’s model shows the market-implied probability of an economic downturn has climbed to 31% from 17% last November. “With softer economic activity data in the US and already weaker business and consumer confidence in recent weeks, the tariffs that came into effect on March 4th on Canada, Mexico and China are raising the risk of an even bigger hit to business and consumer confidence going forward,” said JPMorgan strategist Nikolaos Panigirtzoglou. “In turn, this raises the specter of a US recession, and markets have naturally priced in a higher probability.”
Tariffs and their economic impact are much on everyone’s mind. The Federal Reserve's Beige Book, published last week, stated that "contacts in most Districts expected potential tariffs on inputs would lead them to raise prices, with isolated reports of firms raising prices preemptively." Trump reportedly sees tariffs as a way to reduce the federal deficit. It’s true tariffs will raise revenue, but inefficiently. The U.S. would need to impose 50% tariffs on all imports to raise 40% of what current income taxes bring in, estimates the Peterson Institute, an economy-focused think tank. It’s also true that tariffs will reduce economic activity just like any other tax.
Consumers make up 70% of economic spending. It’s believed that a strong consumer will prevent the economy from sliding into a recession. Lower-income consumers have been struggling for some time now because of inflation. Higher-income consumers have been doing fine. Large increases in stock market wealth is one reason. Big gains in home equity is another reason. Wealth creation for Americans is limited to a small part of the population though. According to the latest Fed data, the richest 10% of Americans account for 87% of all household equity ownership. The stock market in particular has been a wealth creation machine for stock owners. The U.S. market has returned 9.7% annualized since 1900. That is far above bonds at 4.6%, Treasury bills at 3.4%, and inflation at 2.9%, according to UBS.
For those consumers who don’t have much exposure to stocks and don’t own a home, life has been tough for a while now. Over the last five years, median household income has remained flat. (chart below since 1984).
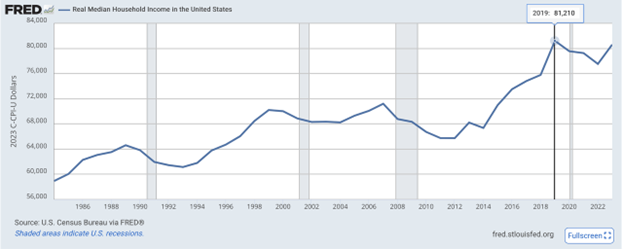
At the same time, the median US home sale price rose 40.7% from $317,200 in January 2019 to $446,300 today. Meanwhile the average 30-year fixed mortgage rate rose from 3.68% to 6.87%.
Consumers and small business owners are feeling the pinch.
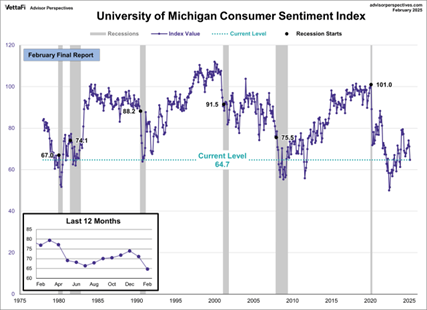
Consumer sentiment is deteriorating rapidly.
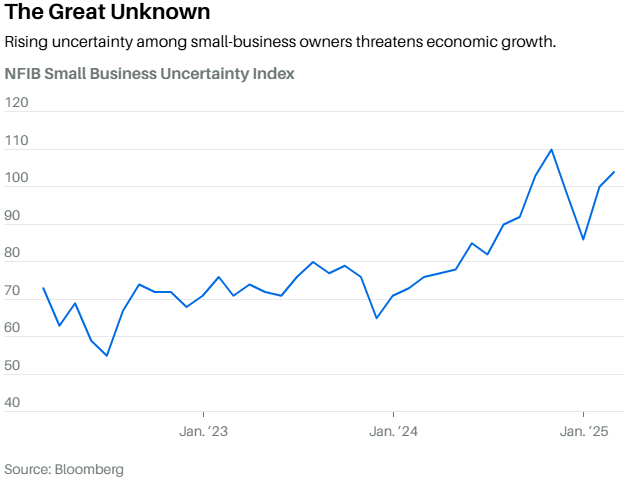
The NFIB Uncertainty Index is a measure of small-business sentiment. It rose to its second-highest level ever in February (see chart above).
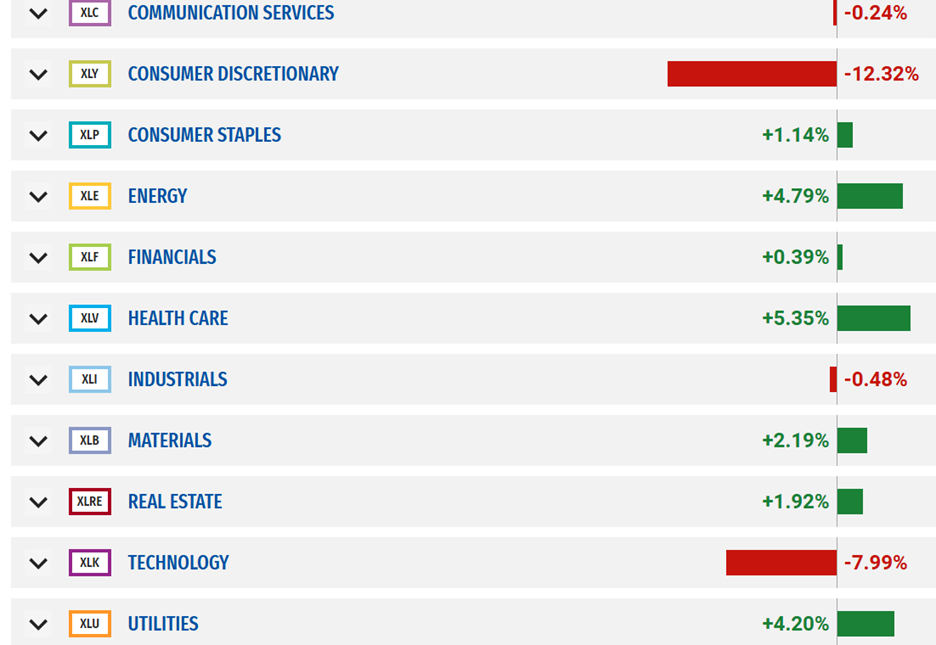
Technology is trailing the S&P but consumer discretionary is doing even worse. Meanwhile, defensive sectors such as health care and utilities are leading. Investors seem to be preparing for a slowing economy and pressure on earnings.
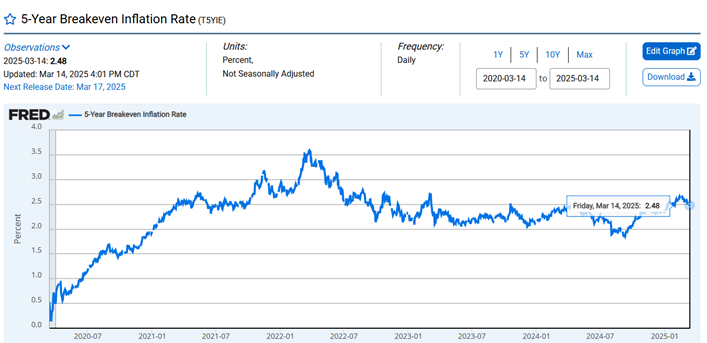
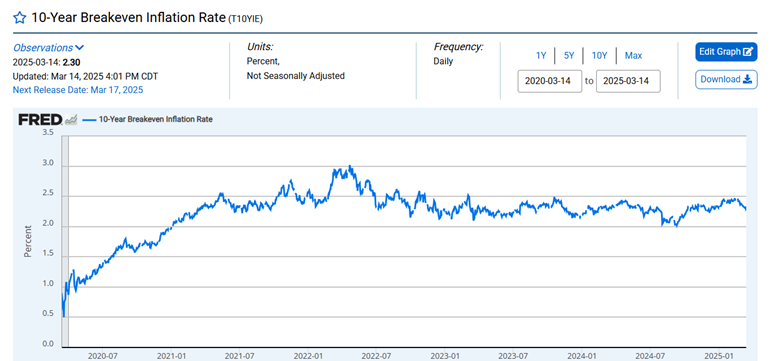
Bond yields have been falling as well, a sign that bond investors are wary of a slowing economy. Bond investors seem less worried about inflation. Breakeven rates are falling.
The 10-year Treasury yield ended the week at 4.31%, unchanged from the week prior but down from 4.80% last December. The 2-year yield was up 2 bps to 4.03% from 4.01%. The 2-year yield is most correlated with the Fed funds rate which is 4.25% to 4.50% currently. The bond market is pricing in two to three rate cuts in 2025 per the CME FedWatch tool.
But it is the 10-year Treasury that the Trump administration is targeting and for good reason. The 10-year yield is what most influences the 30-year mortgage rate. The housing market is still frozen. Lower mortgage rates would make home ownership more affordable. Getting the 10-year yield down is an administration priority. Trump’s tariff uncertainty is leading to interest rate uncertainty though. Tariffs are inflationary but also contractionary. That is price hikes are coming because of tariffs but so is less economic activity. What’s a bond investor to do in a stagflationary environment?
The 10-year has a reason to head towards 4% based on threats to economic activity. But, there are two key constraints to the downside for yields. The first is the expectation for the Fed funds rate going forward. The one-month Secured Overnight Financing Rate (SOFR) is shown below bottoming at 3.25% to 3.50%. SOFR has replaced LIBOR as the overnight lending rate.
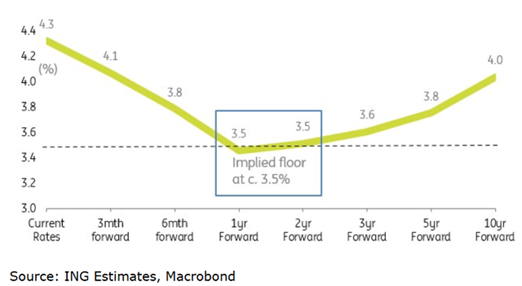
Adding the swap spread in the 10yr, which is currently at around 45bp, gives us an implied all-in rate of around 3.95%. Bond investors seem to believe that the 10-year Treasury is unlikely to go below 4% in the next one to two years. The SOFR will need to fall further, which would only happen if the Fed cuts more than currently expected. The Fed is unlikely to cut the funds rate below 3.5% unless it expects a recession. At the moment inflation isn’t behaving well enough for more than one or two cuts in 2025, if we get any at all.
Interesting Charts
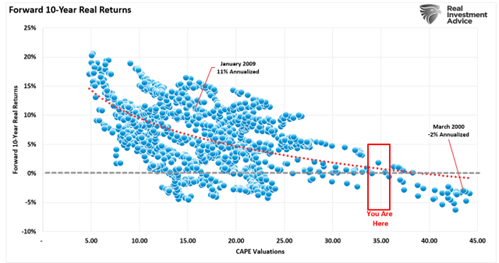
One of a half dozen metrics pointing to subdued stock market returns over the next decade.
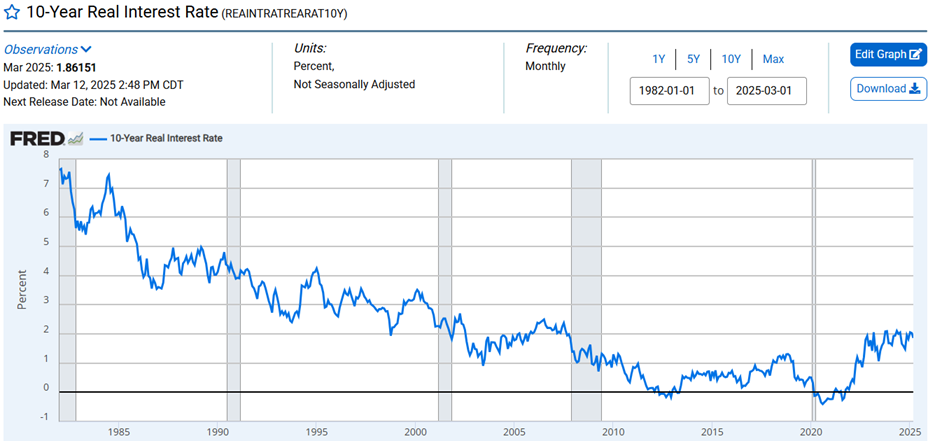
Real yields are high compared to the post-Great Recession era but not compared to the long run. Real yields are the real cost of money. High debt loads make the move higher in real yields problematic. Many businesses looking to roll over debt can't afford it.
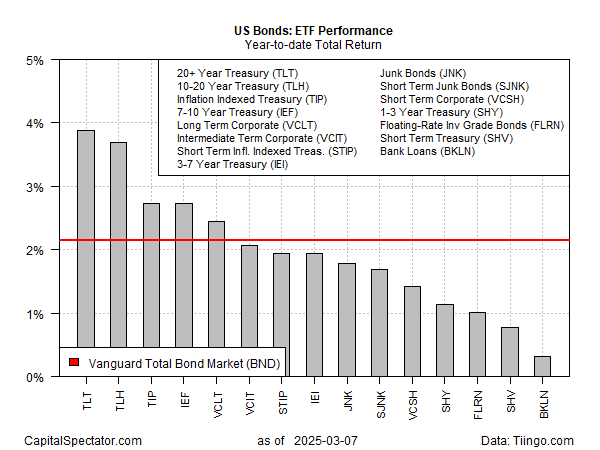
Bonds are having a decent year so far even as stocks sport losses.
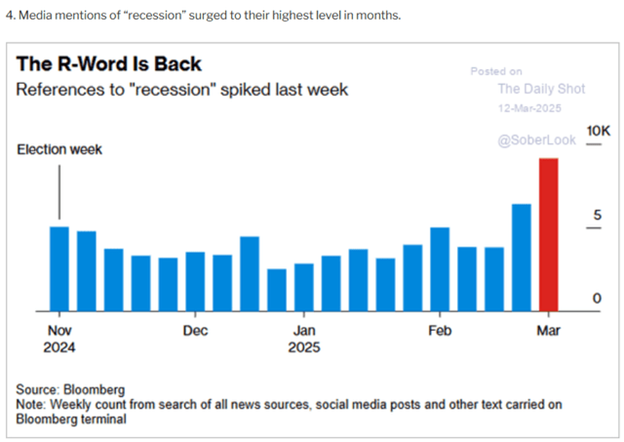
The spike in recession references is comforting. Most people are wrong most of the time when predicting a recession.
Regards,
Christopher R Norwood, CFA
Chief Market Strategist