

Wide range of possible market outcomes in 2024
Investors need to diversify
Market Update
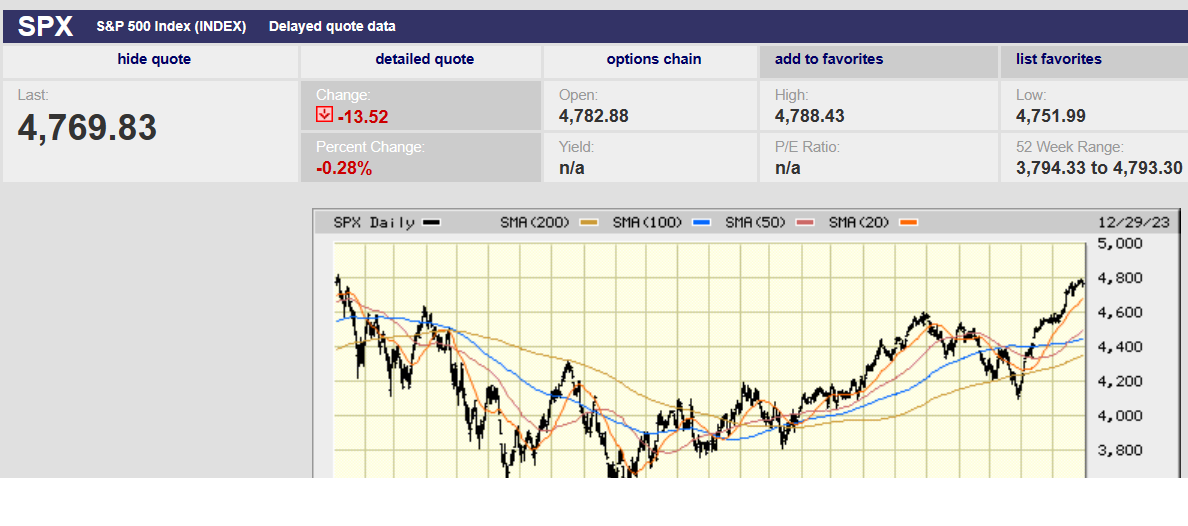
The S&P rose 0.32% the last week of 2023. It closed at 4,769.83, short of its all-time high of 4,818.62. It also closed short of its all-time closing high of 4796.56. Both all-time highs will likely fall in the next few weeks. Market momentum favors it. There is resistance though. It's possible we’ll see a pullback to around 4,600 before a new all-time high is hit.
The market peaked at 4,778.01 and 4,772.94 two weeks ago. It peaked last week at 4,784.72, 4785.39, 4,793.3, and 4,788.43. Sellers are still selling in the upper 4,700s. The S&P did get to 4,793.3 Thursday morning, three points from the all-time closing high. It was the best it could do though. We wrote last week that, “The last 65 points needed for a new all-time high might be tough going.” That has turned out to be the case. Still, it’s hard to imagine traders won’t take at least one shot at a closing record in the coming holiday-shortened week.
The S&P closed the year up 24.2%, its biggest gain since 2021. It fell 18.2% last year. Its two-year return is 0% or 0.0008% for those folks looking for precision. More than two-thirds of S&P 500 stocks have returned less than the index in 2023. Not surprising given how narrow the rally has been in 2023. It was also the first time since 2012 that the index failed to close at a record high at least once during the year.
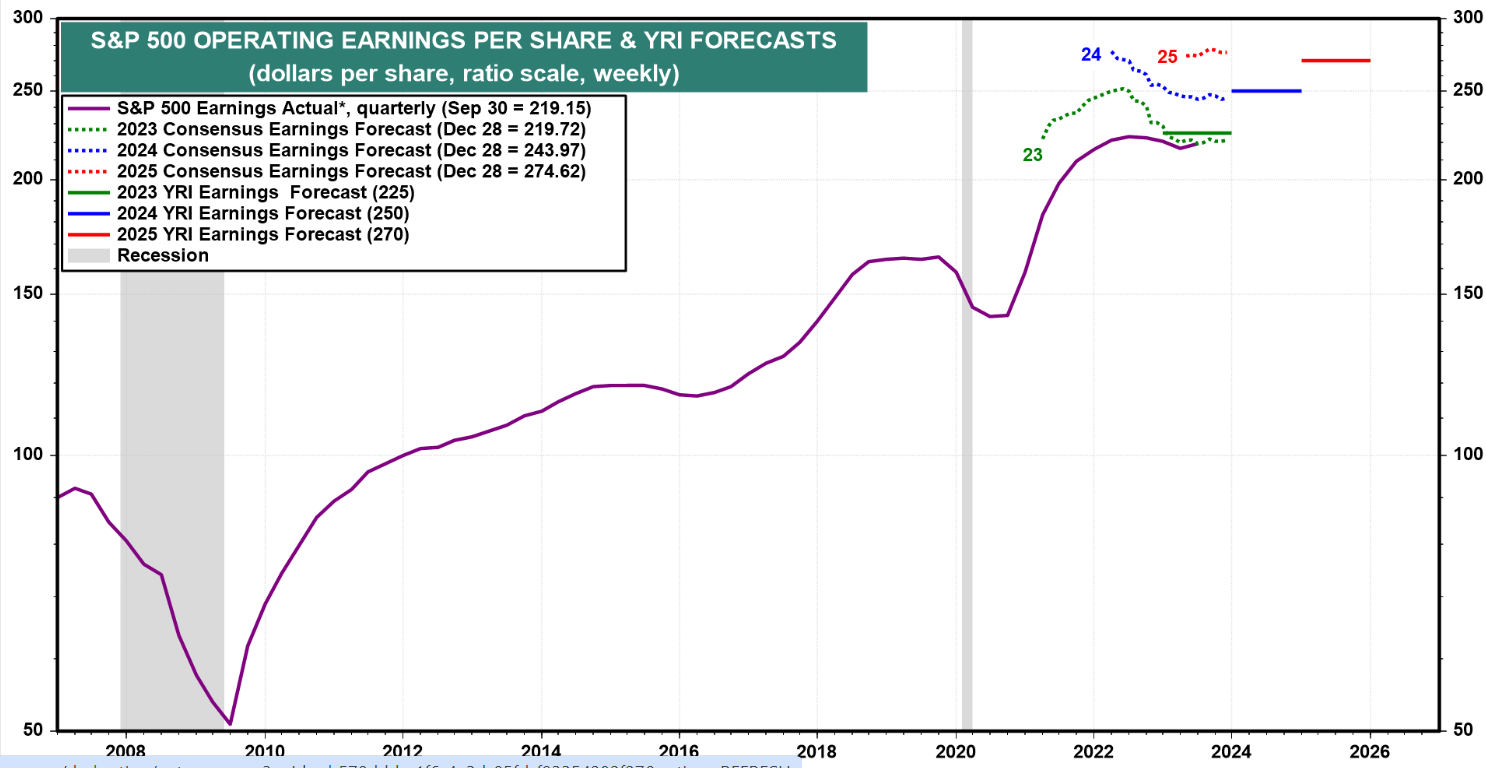
S&P 500 companies are expected to grow earnings by 3% in 2023, according to Barron’s. Eight out of 11 sectors are expected to report earnings growth. Energy and materials firms will see the biggest earnings declines.
Earnings growth needs to pick up if the S&P is to advance in 2024. The consensus estimate is for 11.0% earnings growth in 2024 and 12.5% in 2025. The Fed is forecasting that nominal GDP growth will fall to around 3.8% in 2024 from current forecasts of 5.6% in 2023. Real GDP growth is forecast to rise 1.4% in 2024, according to the Fed. The Fed is expecting inflation to fall to 2.4% by year-end 2024. Nominal GDP growth of 3.8% makes it unlikely that nominal earnings growth of 11% is in the cards for 2024.
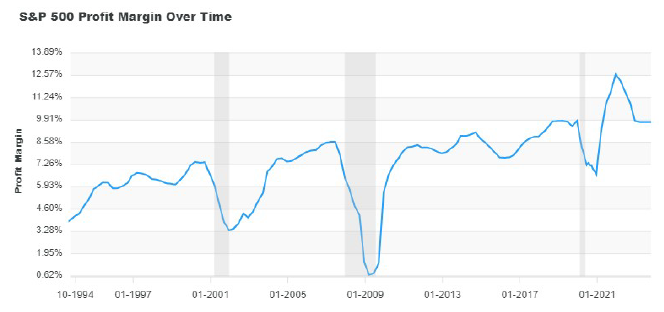
Typically, earnings growth rates trend with nominal GDP growth rates. It would take a large jump in profit margins to close the gap between 3.8% nominal GDP growth and 11% earnings growth. Profit margins are already above the long-term average of 6.15%, far above in fact. The S&P profit margin on a trailing 12-month basis is 9.78%, 59% above the long-run average. Put the pieces together and it suggests that earnings won't grow as forecast in 2024. It also suggests that the market has a higher-than-normal risk of correcting in 2024. A market trading at almost 20x 2024 earnings isn’t going to react well to disappointing earnings.
Economic Indicators
Last week was light for economic data. The biggest news concerned the housing market. Housing and autos are the most interest rate-sensitive parts of the economy. Mortgage rates are around 7% nationally. Yet, U.S. home prices accelerated at their fastest annual rate of the year in October, according to Case-Shiller. Home prices in major U.S. metropolitan areas rose for the ninth month in a row. They hit a record high due to a persistent lack of homes for sale, according to Case-Shiller. Pending home sales were flat in November, an improvement from down 1.5% the prior month.
Initial jobless claims remained low at 218,000. That’s up from 206,000 but still indicative of a strong labor market. Next week economists are forecasting job openings at a still high 8.8 million. Economists are also expecting job growth of 170,000 and unemployment of 3.8% for December. Both numbers indicate a strong labor market. Jobs grew by 199,000 with unemployment at 3.7% in November. The U.S. needs to create only around 100,000 jobs per month to absorb new labor force entrants. Jobs growing faster than the labor force means upward pressure on wages.
Wages and salaries increased 4.8 percent for the 12-month period ending in September 2023, according to the Bureau of Labor Statistics (BLS). Inflation is unlikely to fall to the Fed’s 2% target unless wage growth slows. Wage growth isn’t likely to slow unless unemployment rises.
The ISM services index is expected to show continued expansion this week. The ISM manufacturing index is expected to continue to show contraction. The Atlanta Fed’s GDPNow tool is forecasting 2.3% growth for Q4. The Fed is forecasting real GDP growth of 1.4% for 2024. Investors are likely to experience a growth scare sometime in the first half of 2024. The growth scare is likely to trigger a correction back to around 4,100. The market will fall to the mid-3,000s if the growth scare turns into a recession.
It promises to be an interesting year. There is a wide range of possible market outcomes. It all depends on what happens with earnings, inflation, and interest rates in 2024.
Diversified Portfolios and the S&P 500
I often write about diversification. It is the only free lunch in investing. It is a free lunch in that you get something for nothing. It’s possible to reduce risk without reducing return. That’s a free lunch. It is also possible to increase your return without reducing risk. Same dynamic, different way to view it. Regardless you are increasing your risk-adjusted return.
I had a conversation with a 401k plan participant last week about asset allocation. He had around 15% of his portfolio in the Putnam Stable Value fund. A stable value fund is an insured bond portfolio. It is popular with investors that have low-risk tolerances. The insurance piece of these funds makes them nearly as safe as money market funds. He didn’t know what the Putnam Stable Value fund was, but he did say that it hadn't gone anywhere. "It just sits there," were his exact words. The reason of course is that the share price doesn’t change with a stable value fund. The investor collects the interest rate paid by the stable value fund, similar to a money market fund.
We talked through stable value funds. He let me know he was looking for something with a higher expected return, which means more risk as well. The participant is in his early 30s but is planning on retiring by his mid-50s. He’s already saved $225,000 in his 401k. He's off to a great start but does need to continue saving and investing appropriately.
I asked him about his other 401k account investments. He had exposure to small and mid-cap stocks, a bond fund and the S&P 500 through an index fund. He wanted to move the 15% currently in the stable value fund into the S&P 500. I let him know I didn’t recommend it.
The S&P is a concentrated index. Two stocks make up 14% of the index. The top ten stocks make up 31%. Technology makes up 29.1% of the index and that is understated. The reason it is understated is that Meta Platforms (Facebook) and Alphabet (Google) were moved from technology to communication services a few years ago. They add another 5.8% to technology. And they are both tech firms still, given the importance of their cloud businesses to their earnings growth.
The S&P 500 is concentrated, and it is expensive. That doesn’t mean avoid it altogether, but it does mean don’t overdo it. Smallcaps are cheap. Midcaps are cheap. Emerging market and international stocks are cheap. Drill down into the S&P and you’ll also find sectors and individual stocks that are cheap. The “Magnificent Seven” are not among them. But consumer staples, healthcare, energy, and utilities trailed far behind the S&P 500 index last year. Those sectors are inexpensive. There are deals to be found within those sectors as well. Of course, you need to buy individual stocks or sector ETFs to gain exposure to the cheap without adding to the expensive.
It was a good conversation. I think he listened. I believe he’ll move the 15% from the stable value fund into an age-appropriate target date fund. I encouraged him to put all his 401k account into a single target date fund. Target date funds are diversified. So are our pre-built portfolios. I mentioned that option as well. What I did discourage is him building his own portfolio. Most investors who create portfolios aren’t diversified. They tend to load up on one or two investments instead. Most frequently the S&P 500. I like to point out to those folks that the S&P went nowhere from 1966-68 until 1982. It also went nowhere from 2000 until 2013. Concentrating your portfolio in the S&P 500 during a decade-plus dry spell isn’t going to help get you ready for retirement.
Regards,
Christopher R Norwood, CFA
Chief Market Strategist


