

Double-digit earnings growth isn't sustainable
Market Update
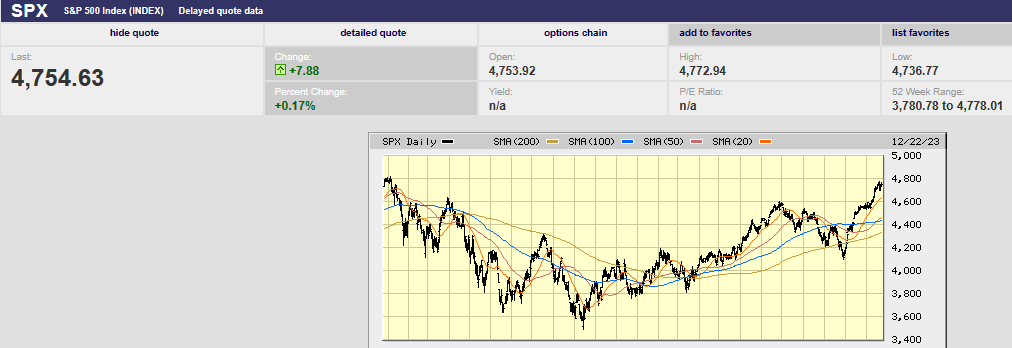
The S&P gained 0.75% and finished the week at 4,754.63. It is its eighth straight winning week for the index. The Nasdaq rose 1.2%. The S&P 500 is up 23.8% in 2023. It is down 1.3% since 4 January 2022. The so-called Magnificent Seven – Apple, Amazon, Alphabet, Meta, Microsoft, Nvidia, and Tesla – have an average return of 112% in 2023. The seven stocks account for around 63% of the S&P 500’s gain this year.
The S&P did run into a sudden round of selling late Wednesday. The index fell from 4,778.01 to close near its low for the day. The sell-off chopped 1.7% off the index in the last three hours of trading. The S&P recouped most of its loss by Friday's open. The market gapped up on better-than-expected inflation news Friday morning. But the high for the day was hit in the first 15 minutes of trading. Selling took the index down around 0.75% before buyers stepped in. The high on Friday was 4,772.94, less than six points away from Wednesday’s high. The last 65 points needed for a new all-time high might be tough going. Sellers have materialized in the high 4,700s on both Wednesday and Friday so far. The market is overbought still. A round of profit taking back toward 4,600 is possible before a new all-time high is hit. Any profit-taking would delay the Santa Claus rally everyone is expecting.
Still, the index is likely to set a new all-time high in the next week or two. And that is despite an expensive S&P. The index is trading at 19.5x 2024 estimated earnings. The 19.5x 2024 earnings multiple is 18% above the long-term average P/E of 16.5x. The market is even more expensive if earnings don’t grow 11% next year as expected. Earnings growth of 12.5% is forecast for 2025. Earnings are forecast to be $219.67 in 2023, $243.98 in 2024 and $274.59 in 2025.
It’s not possible for an economy to grow 2.0% while earnings grow double digits, at least not over the long run. The math doesn’t work. And keep in mind the Fed’s own research, cited in our newsletter in the last few weeks. The tailwind of lower interest rates and lower taxes is gone. Real corporate earnings growth is forecast to settle around 3.0% to 3.5% in the coming decade. Companies will need to buy back a lot of stock to push earnings per share growth into double digits. Most companies won’t have the cash flow to make that happen.
But there are investments that are less expensive. Less expensive means higher returns with less risk.
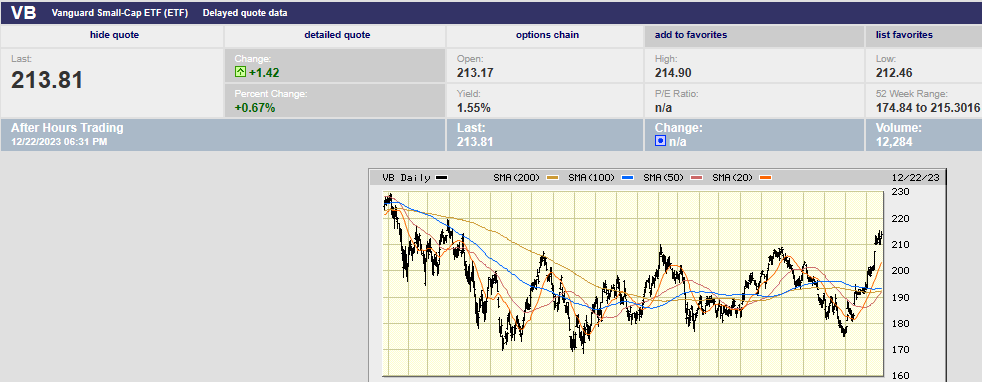
Small-cap and emerging market stocks have gone nowhere over the last few years. Small-cap stocks have a market capitalization of $3 billion or less. Small caps are cheap. The S&P 600 small-cap index is down 12% from its November 2021 record high. The S&P 600 index has only profitable companies in it. It is a requirement for inclusion in the index. The better-known Russell 2,000 allows companies that aren’t profitable into the index. Currently, 40% of the Russell 2000 index companies are unprofitable.
Higher interest rates have been driving the drop in small-cap stocks. The Vanguard Small Cap S&P 600 Index peaked on November 8th, 2021. The Nasdaq peaked on November 22, 2021. Both indexes were anticipating the start of Fed rate hikes. The Fed started raising rates in March 2022.
Fast forward and small caps are inexpensive. “They have priced in a recession that has yet to materialize,” says Francis Gannon, co-chief investment officer at Royce Investment Partners. The S&P 600 trades at 14x the next 12 months’ earnings. It trades 28% lower than the S&P 500’s 19.5x. Small-cap stocks are close to the cheapest they have been versus large caps in the past decade, according to FactSet.
Overweighting small caps should increase investor returns in the next few years.
Economic Indicators
The Conference Boards' U.S. leading economic indicators (LEI) for November fell by 0.5%. The LEI fell 1.0% the prior month. The index has fallen 20 months in a row. It contracted by 3.5% over the six-month period ending in November. It contracted by 4.3% in the prior six-month period. “The US LEI continued declining in November, with stock prices making virtually the only positive contribution to the index in the month,” said Justyna Zabinska, who is with the Conference Board. The Conference Board is forecasting a short, shallow recession in the first half of 2024.
The Conference Board’s coincident indicators index (CEI) rose by 0.2% in November. It showed no change in October. The CEI is now up 1.0% over the six-month period ending in November compared to 0.7% growth over the prior six months. Personal income less transfer payments was the strongest contributor to the CEI.
The personal consumption expenditure index (PCE) rose 2.6% year over year in November. The PCE rose 2.9% year over year the prior month. The headline PCE fell month to month for the first time since April 2020. It fell 0.1%. Core PCE grew by 3.2% year over year in November. Economists had predicted a 3.4% increase in core PCE, according to Barron’s. Core PCE rose 0.1% month over month, better than the forecast 0.2%.
November’s numbers put the six-month annualized core PCE at 1.87%, according to Mike Konczal, director of macroeconomic analysis at the Roosevelt Institute. The market took the inflation numbers as further proof that the Fed will cut next year. The FedWatch Tool has the odds of a cut in March at 78.1%. The FedWatch Tool has the odds of six to seven cuts by year-end 2024 at approximately 74%. Meanwhile, the Fed’s updated December “Dot Plot” shows three-quarter point cuts next year. A fed funds rate at 3.50% to 3.75% by year-end 2024 is unlikely without a recession. Investors will be disappointed one way or the other. Either rates don’t fall as far as anticipated or the economy doesn’t do as well as expected.
Consumer Confidence rose to 110.0 in December from 102.0. Economists polled by the Wall Street Journal had forecast 104.5. The December reading is a five-month high. Initial jobless claims remained low. Last week saw 205,000 initial claims, up a tick from the 203,000 the prior week.
The Atlanta Fed GDPNow tool is expecting GDP growth of 2.3% for Q4, below Q3’s 4.9% GDP growth. The Fed’s December SEP report is forecasting GDP growth of 1.6% in 2024. The Fed also expects unemployment to be at 4.1% and Core PCE to be at 2.4%. The Fed expects the federal funds rate to end the year at 4.4%. In other words, the Fed sees a soft landing in 2024, but with rates higher than expected by investors.
We’ll have to see whether investors or the Fed is more right. A recession is in the cards if investors are correct that the Fed funds rate will be at 3.50% to 3.75% by year-end 2024.
Stocks versus Bonds
Emerging market stocks have gone nowhere over the last decade. They had a monster run during the “ought's”. The MSCI Emerging Markets Index posted an annualized return of 15.9% from 2001 to 2010. Meanwhile, the S&P 500 was posting a negative return. Emerging markets have struggled since 2011. The Vanguard Emerging Market Index ETF (VWO) has traded sideways since the Great Recession. More recently VWO is down 29% since hitting a high on Feb. 16th, 2021.
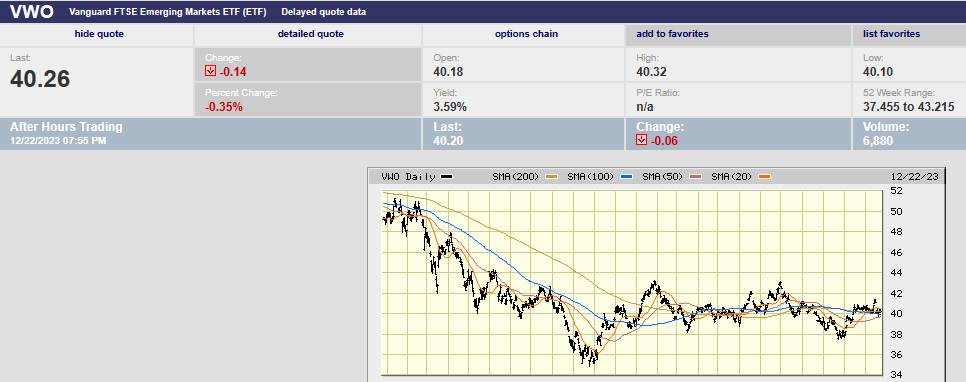
Emerging markets got ahead of themselves during the EM bull market of 2001-2010. Prices outpaced earnings growth. China’s economic growth is moderating after the huge surge that began at the turn of the century. As well, the U.S. dollar has been strengthening since 2014. A stronger dollar is negative for emerging markets. Capital flows away from them and into the U.S. when the dollar is strong.
Emerging markets will benefit from central banks cutting interest rates around the world. The dollar should begin to weaken as the Federal Reserve cuts rates. A weaker dollar historically has been a positive for emerging markets. A weaker dollar boosts returns for U.S. investors. It also reduces borrowing costs for countries with dollar-denominated debt. “There are few drivers as strong for equity market reratings as the combination of decent economic growth and falling interest rates,” wrote Louis-Vincent Gave, head of Gavekal Research, in a recent client note on emerging markets.
Morgan Stanley has been expecting emerging markets to shine since late 2022. It hasn’t happened yet but that doesn't mean it won't. The MSCI Emerging market index is up single digits in 2023 while the S&P 500 has gained over 20%. Morgan Stanley, along with other wire house brokers, still thinks the outperformance is coming. MS lists several reasons why including:
- Higher economic growth rates than developed countries.
- Better sovereign balance sheets than developed countries.
- Less corporate leverage for EM companies compared to DM companies.
- Improved EM external balances compared to the last decade.
- EM equities and currencies trading at crisis level valuations.
Home bias prevents many investors from allocating as much as they should to international markets. Investors prefer owning companies with which they are familiar. Home bias hasn’t hurt U.S. investors over the last decade. There is a good chance it will cost investors in the coming decade though.
Regards,
Christopher R Norwood, CFA
Chief Market Strategist


