

The Fed is forecasting 3 rate cuts in 2024.
Bond investors are forecasting 6 rate cuts in 2024.
We will see who is more right.

Market Update
The S&P surged 2.5% higher last week. A dovish Fed gave investors all the encouragement they needed. Monday saw the S&P take out the 4,607.07 July 27th high on a closing basis. The index finished Monday at 4,622.44. The index closed at its high on Tuesday, always a bullish sign. The S&P hit 4,709.69 on Wednesday, with all the gain occurring after the Fed announced its meeting results. The S&P gapped up Thursday morning, before it finally ran out of steam in the first 30 minutes of trading. The index hit 4,738.57 around 10 a.m. but closed at only 4,719.55. It put in a lower high on Friday. The price action last week was all about the dovish SEP report.
The S&P is now extremely overbought short term. A pullback to 4,600 is likely as the market digests its gains. Any more significant pullback will likely need to wait until next year. There is little likelihood of a meaningful pullback before earnings season. The first reports will come in the middle of January. Earnings guidance will need to be strong if the rally is to continue.
The 10-year Treasury yield finished the week at 3.92%. The two-year yield is at 4.48% and the 30-year yield is 4.02%. The 10-year bond closed below 4% for the first time since July 31, 2023. The overwhelming consensus is that interest rates are going lower in 2024. The Fed’s December SEP indicates three quarter point cuts in 2024 up from two in the September SEP report. Meanwhile, the CME FedWatch tool is forecasting six cuts. The Fed and investors are still disagreeing over the number of cuts in 2024. It remains to be seen which camp will prove more right.
The jobless rate was 3.7% in November, near 50-year lows. The Fed’s mandate of full employment has been met. Inflation is well above the Fed’s 2% target. Core consumer prices were up 4.0% in the 12 months to November. The Fed’s mandate for price stability has not been met. It’s rare for the Fed to cut rates when core CPI exceeds the unemployment rate, according to Michael Hartnett of Bank of America. Fed cuts of 1.5% as anticipated by investors would recall the Fed pivot in 1975. Of course, the 1975 pivot led to inflation roaring back throughout the rest of the 1970s. It’s considered one of the Federal Reserve’s worst monetary mistakes ever.
And a no-landing scenario is possible. An economy reaccelerating in 2024 would likely lead to inflation remaining a problem. Bond yields would likely reverse back above 5%. Rising yields would cause problems for an expensive stock market. The Atlanta Fed GDPNow tool’s latest estimate is for 2.6% GDP growth for Q4 2023. Growth at that rate doesn’t suggest the need for rate cuts.
But inflation might continue to fall this time, unlike in the 1970s, even with three to six rate cuts on the table. We pointed out a few weeks ago that there is a divergence between Gross Domestic Product (GDP) and Gross Domestic Income (GDI). Stephanie Pomboy of Macro Mavens noted the same last week. Pomboy sees a disconnect between GDP and GDI. GDP rose 3% year-over-year during the third quarter while GDI fell 0.2%. Rarely are the two measures of economic activity so out of sync. GDI proves the more correct when the two do diverge. The last time we had positive GDP and negative GDI was before recessions in 2001 and 2007, according to Barron’s.
The risk of recession in the U.S. is higher than normal. Leading indicators are signaling that a recession is on the horizon. That said, a soft landing is the consensus among economists for now. But Global GDP is growing at just 1.5%, after inflation. It is a pace that was consistent with recession in the past 50 years, Felix Zulauf told Barron’s last week. Europe is stagnating or in a recession, as is China. In short GDI may prove more right once again. The Fed may end up cutting six times in 2024 as a recession lands on U.S. shores.
Economic Indicators
The big news last week was the Fed’s “dot plot” change. The Fed is now anticipating three rate cuts in 2024 instead of only two. The median Fed Funds Rate (FFR) forecast for year end 2024 is 4.6% down from the prior 5.1%. Core CPI was 0.3% in November up from 0.2% the prior month. Year-over-year CPI was 4.0% unchanged from the prior month. The PCE index comes out this week. It is the Fed's preferred inflation measure. The core PCE estimate is for a 0.2% rise in November. Core PCE year-over-year is forecast at 3.5%. None of the inflation numbers are anywhere near the 2% Fed target. Both the Fed and investors are placing a lot of weight on the trend being their friend. Specifically, that inflation will continue to trend lower in the coming months.
And it might. Shelter costs are keeping the inflation rate from falling faster. Shelter prices are the biggest expense for most families. Rents jumped 0.5% on the month and are up 6.9% in the past year. Economists are forecasting that the cost of shelter is likely to slow in coming months since rents aren’t rising as fast. Changes in rents and housing prices feed into the CPI with about a six-month lag. Economists are assuming that the other inflation components continue to cooperate as rising shelter costs slow. They may but they may not.
Stocks versus Bonds
Wire house bank strategists are all over the map when it comes to their forecast for S&P 500 returns in 2024. The average price target among six market strategists polled by Barron’s is 4,838. That’s only about 2.5% above the S&P’s Friday close. Ed Yardeni had the highest number at 5,400. He’s also forecasting the highest S&P earnings at $250, almost 14% above the 2023 level. Mike Wilson of Morgan Stanley has the lowest target price for the S&P 500 at 4,500. He has earnings for 2024 of $229, a 4% increase. The S&P forward P/E is 19.1x well above the long-term average of 16x. That is assuming earnings grow by the forecast 11.8% in 2024. The market is more expensive if earnings growth fails to match expectations.
Peter Lynch of Fidelity Magellan fame thinks small-cap stocks are the place to be in 2024. Lynch pointed out recently that, “We’ve been in an incredible bear market for two years.” He says if the seven mega-caps are excluded that the rest of the stock market has underperformed. In fact, many stocks are still trading below their 2018 highs.
The gap between small cap and large cap performance is as great as it has been in twenty years, according to Barron’s. Reuters wrote recently that U.S. small caps are near their lowest-ever values relative to large caps. The small-cap S&P 600 trades at 13.7 times forward earnings. Its long-term average is 18. The 13.7x is well below the S&P 500's current level of 19x earnings.
There are other investing relationships that are due to mean revert besides small caps. (The following is courtesy of Jeff Weniger, CFA who is Head of Equity Strategy at Wisdom Tree).
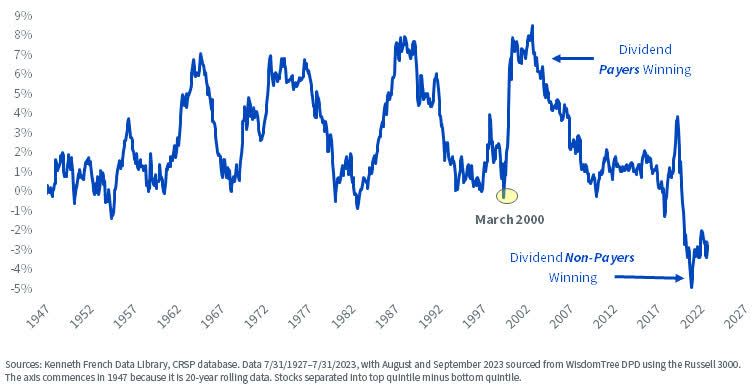
The last two decades have seen firms with a zero percent dividend yield outperform the highest yielders by more than at any time in pre-COVID history.
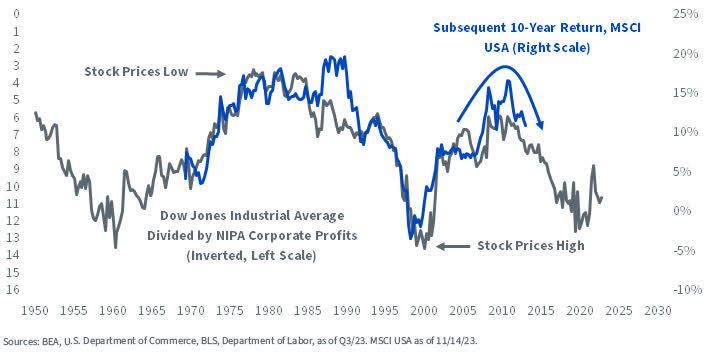
The Dow industrials average is expensive relative to NIPA Corporate profits. A mean reversion would put a lid on stock returns in the coming years.
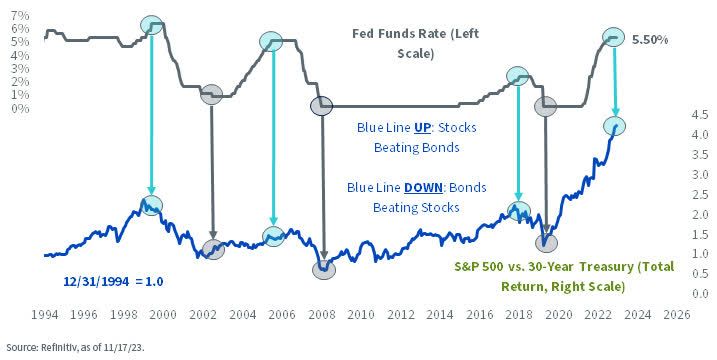
The end of tightening cycles favors long-term bonds over stocks.
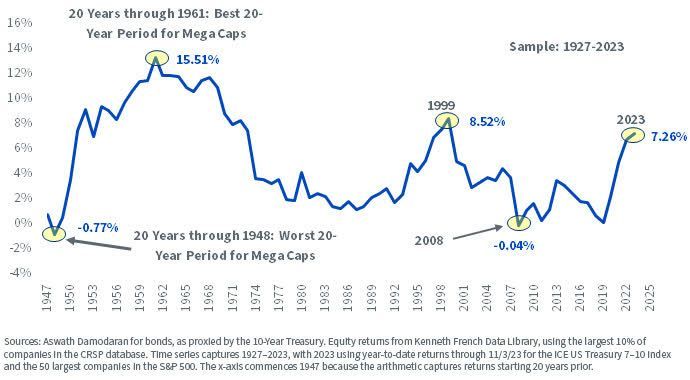
Bonds have underperformed stocks over most of the period since the Great Recession. That is especially true since 2018. Currently, we are at 20-year extremes in equity outperformance over bonds.
Summarizing the four charts:
- Companies that pay no dividends just completed the greatest period of outperformance ever versus the biggest dividend payors.
- The Dow relative to NIPA corporate profits points to poor stock performance in the coming decade.
- The end of the Fed’s tightening cycle points to bonds beating stocks, at least in the next few years.
- The 2003-2023 period witnessed stocks beating bonds by more than any other twenty-year period except the 20 years after WW II and from 1979 – 1999.
Regards,
Christopher R Norwood, CFA
Chief Market Strategist


