

Executive Summary
- The jobs report on Friday sparked stock and bond market selling
- Economic data hasn't justified rate cuts
- The Bond market has been signaling its disagreement with the Fed since the September cut
- The 10-year Treasury Yield is rising. Bond investors see inflation risks
- The Jobs market is strong
- Disinflation is slowing
- Investors should expect more volatility in 2025
- Diversification means less portfolio volatility but also lower returns
- True diversification means always owning something that is underperforming
- Diversified portfolios will trail during a bull market
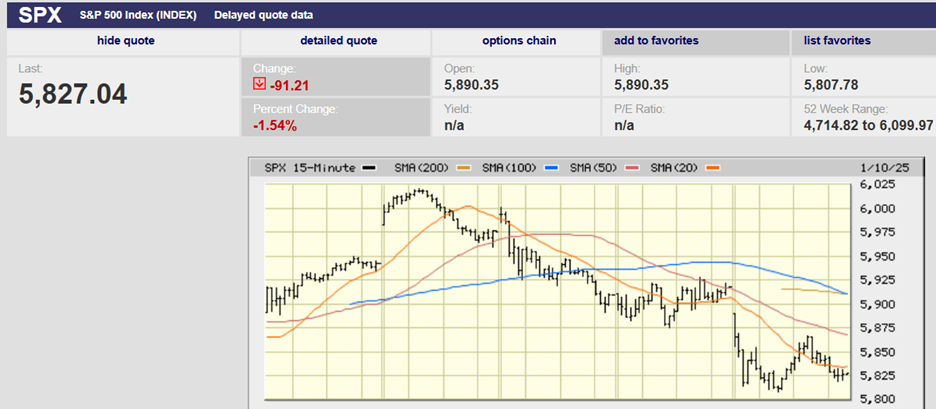
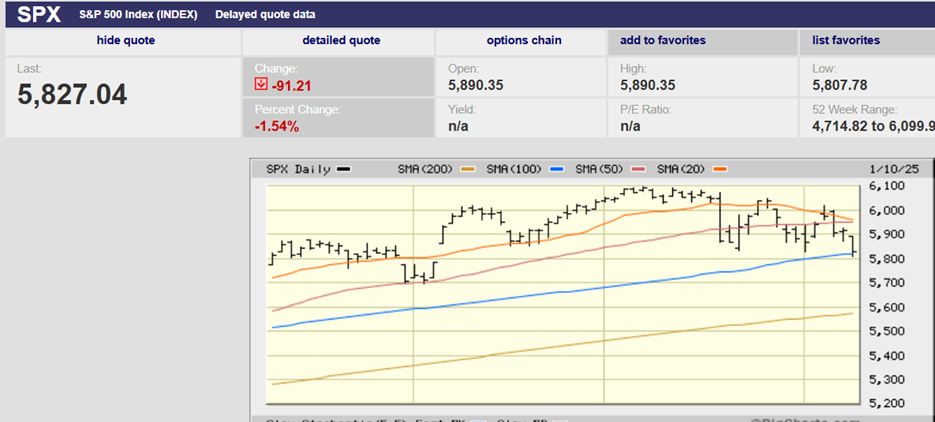
S&P 500 5-day chart
Last week, we wrote that " the jobs report has the power to move the market. A better or worse-than-expected number could lead to serious volatility on Friday. The volatility could carry over into the following week.” We got the volatility on Friday because of the jobs report. We’ll see if we get more volatility in the coming week.
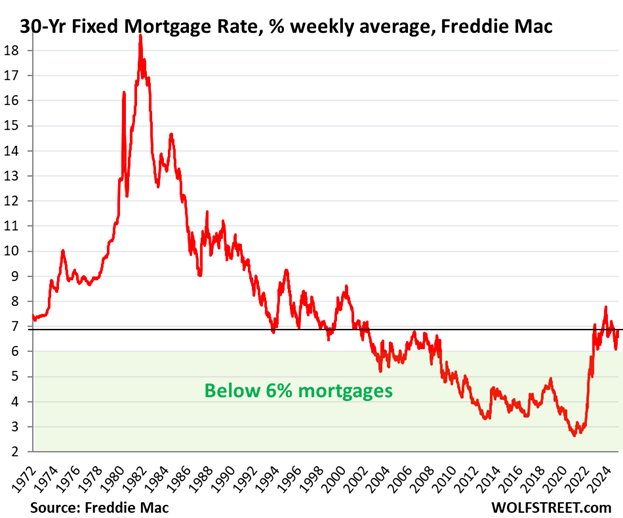
The jobs report released Friday was much stronger than expected. The stock and bond markets sold off as a result. The S&P 500 fell 1.54% on the day. It lost 1.9% during the week, finishing at 5,827.04. The Nasdaq fell 2.5% on the week. Bonds didn’t do any better. The 2-year Treasury yield rose to 4.39% by Friday. The 10-year yield rose to 4.76% from 4.60% the prior Friday. The 10-year yield hasn’t been as high since late 2023. The 10-year yield was 3.63% when the Fed began cutting rates in September. Mortgage rates are back over 7%.
We’ve been writing for months about a data-dependent Fed that doesn’t really seem to be data-dependent. We’ve pointed out that the data doesn’t warrant interest rate cuts. Yet the Fed has cut the funds rate by 100 basis points since September. It did so based on the notion that an unobservable neutral rate was somewhere around 3%. The Fed seemed to believe the gap between the funds rate and the estimated neutral rate was too wide. So, there was a need to lower the funds rate to closer to 3%. This is despite a wide range of estimates of the neutral rate by Fed officials.
A wide range smacks of uncertainty. The December Summary of Economic Projections (SEP) showed estimates ranging from 2.8% to 3.6%. Sonal Desai thinks the neutral rate is 4%. Desai is Chief Investment Officer at Franklin Templeton Fixed Income. Her guess is as good as any Fed official's. Importantly, the bond market seems to agree with Desai. Or at least it has been signaling its disagreement with the Fed since the September cut.
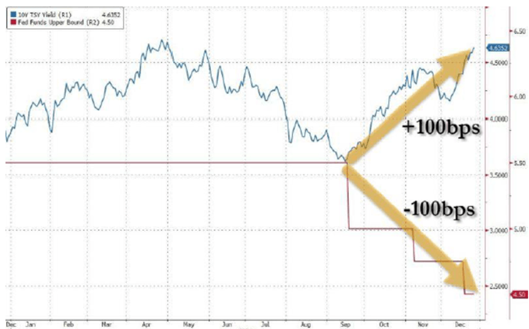
The 10-Year Treasury Yield is going the wrong way. Bond investors see inflation risks
(See last week’s newsletter for more on rising interest rates and the strong labor market).
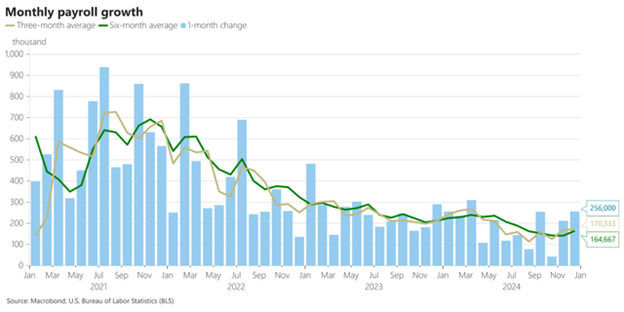
Payroll growth with the latest jobs report added
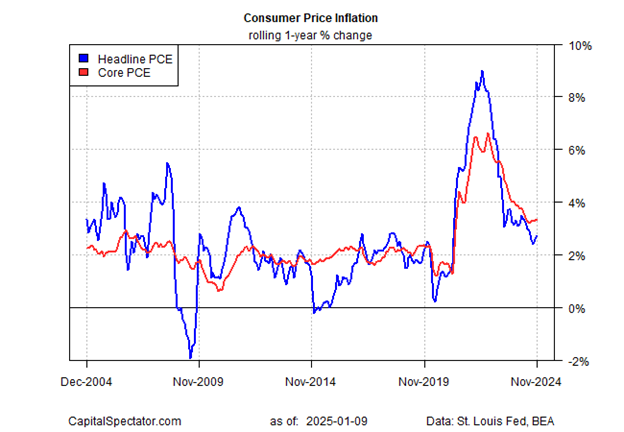
Norwood Economics has also cautioned for months that disinflation is slowing and could reverse. The core personal consumption expenditures (PCE) price index has been stuck at 2.7% - 2.8% since August.
The gradual but persistent rebound in core CPI suggests inflation has stabilized. Core CPI is running at a 3.3% annual rate. The Fed is far away from its 2% inflation target.
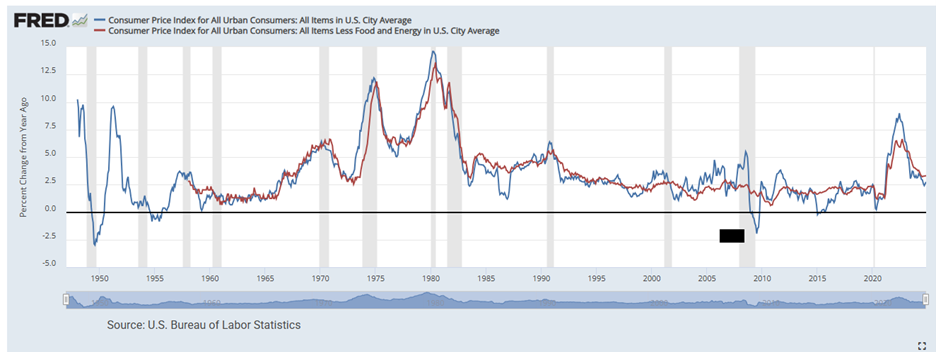
The red line above is Core CPI
Below Courtesy of James Picerno of CapitalSpectator.com:
“A more concerning trend is shown by 5-year inflation expectations via the Treasury market, based on two models. One is the 5-Year/5-Year Forward Inflation Expectation Rate; the second model is based on the implied market forecast using the yield spread on the 5-year nominal Treasury less its inflation-indexed counterpart.”
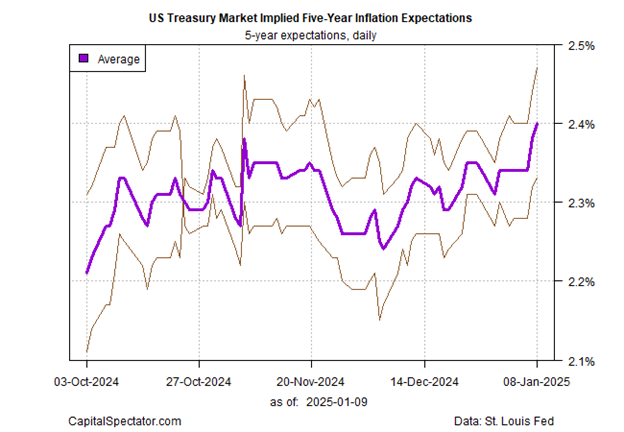
“The upside bias for the average in recent weeks is starting to look worrisome.” According to Picerno. “If this average continues to run higher, the trend will soon signal a flat-out warning on inflation.”
The jobs report showed a surge in hiring with 256,000 new jobs added in December. It was some 100,000 more than economists forecast. The unemployment rate dipped by 0.1 percentage point, to 4.1%. The homerun jobs report resulted in selling in both the stock and bond markets. Rate cut expectations are changing. We could see more volatility in the coming week.
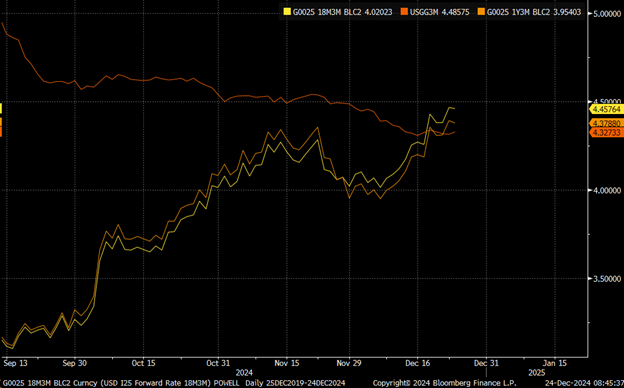
The CME FedWatch tool isn’t pricing in a rate cut until at least May. Forward contracts for the 3-month Treasury bill—specifically the 12-month and 18-month forward rates—are trading above the current 3-month Treasury bill spot rate. Forward contracts are indicating that rate cuts are history, and hikes may occur in the next 12 to 18 months.
“With the December jobs report, the only mystery is why the market is still forecasting cuts in the funds rate in 2025 and 2026,” Steven Blitz, chief U.S. economist at TS Lombard, wrote in a research note on Friday. Blitz sees 3% real gross-domestic-product growth and 3% inflation. He expects no cuts in 2025. He sees as much as 100 basis points of hikes in 2026. A 6% 10-year Treasury yield is “far from a stretch given the history and the volatility that the Trump administration is bound to usher in,” wrote Blitz.
Rising yields can lead to contracting P/E multiples. Robust earnings growth estimates need near-record profit margins. The coming earnings season and guidance from the C-suite will tell us a lot about the short-term direction of the stock market.
There are indications of a looming short-term top on a technical basis. We wrote last week that, “The S&P 500 may be putting in a short-term top. The 20-day is falling toward the 50-day. It hasn’t crossed yet but will in the next week or two if the index can’t regain some momentum.”
S&P 500 3-Month Chart
The S&P 500 held the 100-day moving average on Friday. There is support around 5,800. The 20-day is going to cross the 50-day moving average in the coming week. The algorithms will factor that in and more selling could ensue. A “dark” cross, as it’s known, indicates that the near-term direction of the market is down. A close below 5,800 and the 100-day would solidify the technical case for a short-term top.
We also wrote last week that, “sentiment is extremely bullish with investors expecting another double-digit gain in 2025. A correction early in the new year wouldn’t be a surprise. Barring a deterioration in the economy, any pullback should be a buying opportunity.”
The correction may already be here. A 10%-15% pullback in the market would be completely normal. The economy is strong, although earnings estimates are likely too high. Returns are likely to be muted this year but still positive.
More selling this week is likely. The VIX is only 19.54. It needs to rise into the mid-30s before sufficient fear allows a bottom to form. That’s assuming this is the start of a 10% to 15% pullback, which isn't a given. Investors should expect more volatility in 2025.
Stock/Bond/Commodities/Precious Metal Portfolios Equals Real Diversification
You can’t have your cake and eat it too. Diversification means less portfolio volatility. It also means lower returns, although possibly higher risk-adjusted returns. Risk-adjusted returns are what matter. Efficient portfolios mean higher risk-adjusted returns. True diversification means always owning something that is underperforming. One hundred positions that move in lockstep means zero diversification.
People love diversification when markets are falling. They get angry though when their portfolios trail during a bull market. It’s worth noting again. You cannot have your cake and eat it too. Higher returns mean accepting higher risk (more volatility).
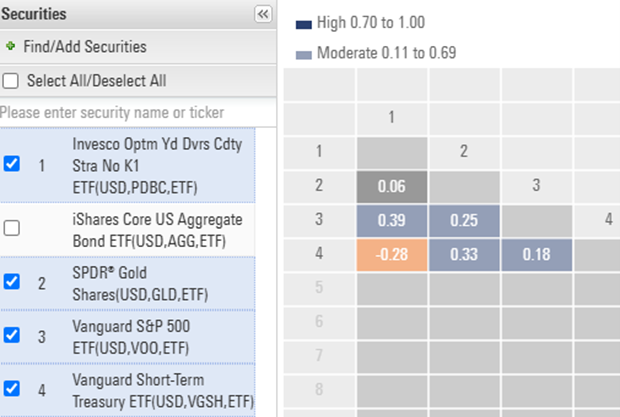
Bonds are the go-to for investors who don’t want the 17.5 standard deviation of the S&P 500. Bonds are less volatile by half or more. The iShares Core U.S. Aggregate Bond ETF (AGG) has a 5-year standard deviation of 6.4. The Vanguard Short-Term Treasury Index fund ETF (VGSH) has a 5-year standard deviation of 2.0. Standard deviation is the square root of variance. Standard Deviation gives you an idea of how much volatility to expect with an investment.
More importantly, The AGG has a 5-year correlation to the S&P of 0.57. The VGSH has a 5-year correlation to the S&P of 0.18. A correlation of one means no diversification. A correlation of 0.18 means lots of diversification. Investors must own assets other than stocks for real diversification. Treasury bonds, commodities, and precious metals all fit the bill.
All-Weather Portfolio
The Ray Dalio-inspired all-weather portfolio is a truly diversified portfolio. It should perform well in all economic environments. But you won’t keep up with the S&P 500 when it is climbing.
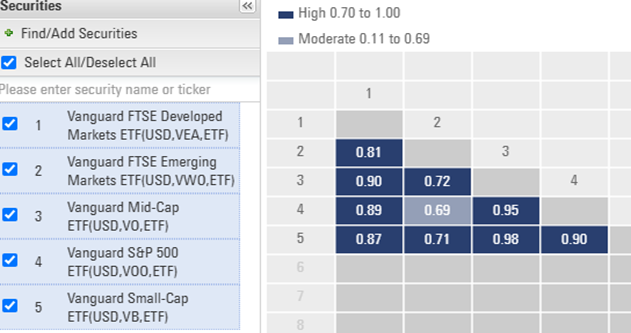
Diversified Stock Portfolio
A diversified stock portfolio (chart above) isn’t all that diversified. Although, the emerging market/S&P 500 correlation is noteworthy. Investors need to decide how much risk they’re willing to take. A lower-risk approach requires owning assets other than just stocks. Returns will be lower but risk-adjusted returns can be higher. Food for thought…
Regards,
Christopher R Norwood, CFA
Chief Market Strategist


