

Executive Summary
- The Santa Claus rally was a no-show this year
- Friday's jobs report might bring volatility
- Economic data continues to point toward a strong economy
- The stock market is near all-time highs
- Corporate bond spreads are near record tights
- Liquidity is abundant
- No signs of a recession. The Fed is backing away from aggressive rate cuts.
- Inflation concerns are re-emerging
- 2024 in Review
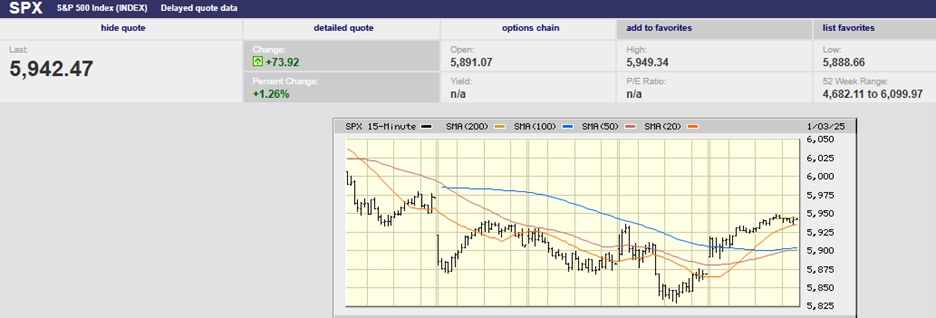
S&P 500 5-day chart
Market Update/Economic Update
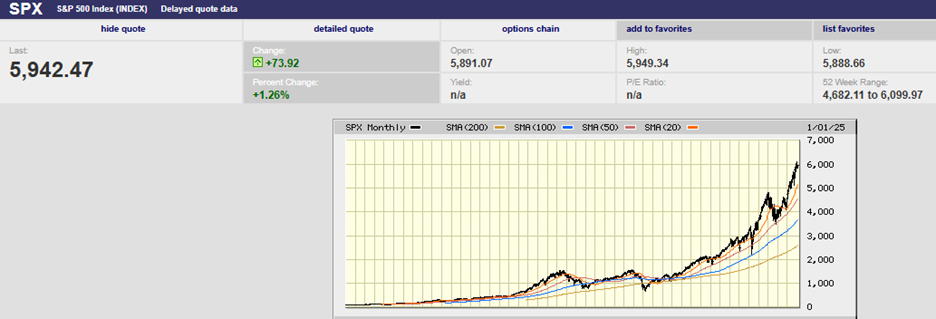
The S&P 500 lost 0.5% last week, finishing the holiday-shortened week at 5,942.47. The Santa Claus rally was a no-show this year. The last five trading days of the year and the first two of the new year normally produce a positive return. Not this year. The S&P was at 5,974.07 at the start of the Santa Claus rally window. It reached 6,049.75 by day two. It was downhill from there with a lower gap opening on Friday 27 December. The index bottomed out on Thursday afternoon 2 January at 5,829.53 at around 1:45. Friday saw some recovery of the lost ground with a gain on the day of 1.26%. It wasn’t enough for a positive week let alone a Santa Claus rally.
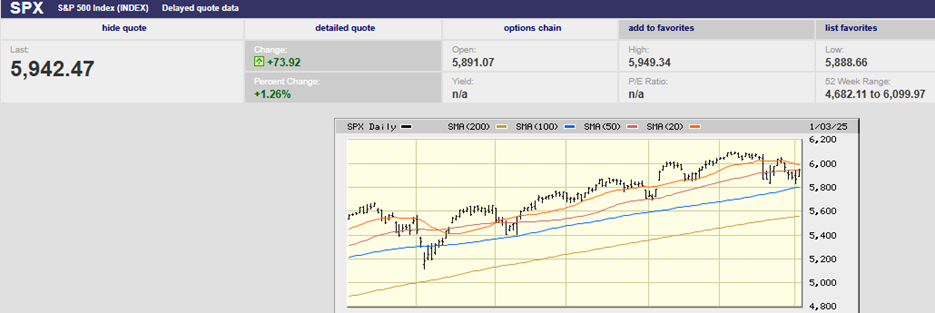
S&P 500 6-month chart
The S&P 500 may be putting in a short-term top. The 20-day is falling toward the 50-day. (see chart above) It hasn’t crossed yet but will in the next week or two if the index can’t regain some momentum. Resistance is building around 6,000. Sentiment is very bullish, with investors expecting another double-digit gain in 2025. Three double-digit gains in a row are rare. A correction of 10% or more early in the new year wouldn’t be a surprise. Barring some economic deterioration though, any pullback should be a buying opportunity. The stock market has too much momentum for a bear market to materialize. Tops take time to form, usually two to nine months.
The main economic news due in the coming week is the jobs report on Friday. The forecast is for a gain of 155,000, down from 227,000 the prior month. The unemployment rate is expected to remain at 4.2% for December. Hourly wages are forecast to increase by 0.3% down from a 0.4% gain in November. The annual hourly wage increase is estimated at 4.0%, the same as the prior month. The jobs report has the power to move the market. A better or worse-than-expected number could lead to serious volatility on Friday. The volatility could carry over into the following week. The VIX is currently at a benign 16.13, indicating a lack of fear in the stock market. (The VIX is a real-time measure of the stock market’s expectation of volatility over 30 days. It is based on S&P 500 index options trading, meaning real money is on the line.)
Last week initial jobless claims came in at a better-than-expected 211,000. Jobless claims fell from 220,000 the week prior. The claims number was better than the forecast of 225,000. It’s another indication of a strong jobs market.
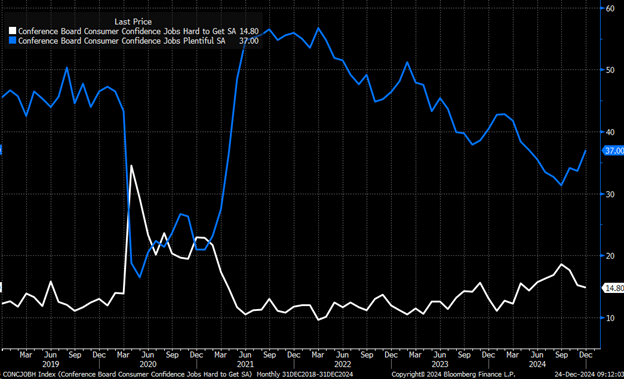
The jobs-hard-to-get index is also signaling a strong employment picture. The current move lower in the index (white line above) suggests the unemployment rate should move lower over the next couple of months.
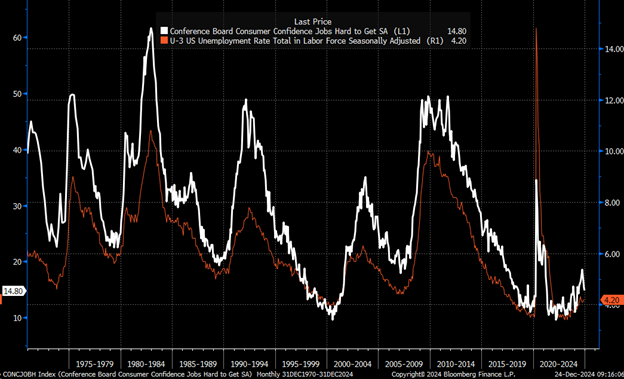
The index tends to be a very good indicator of the unemployment rate. (see chart above)
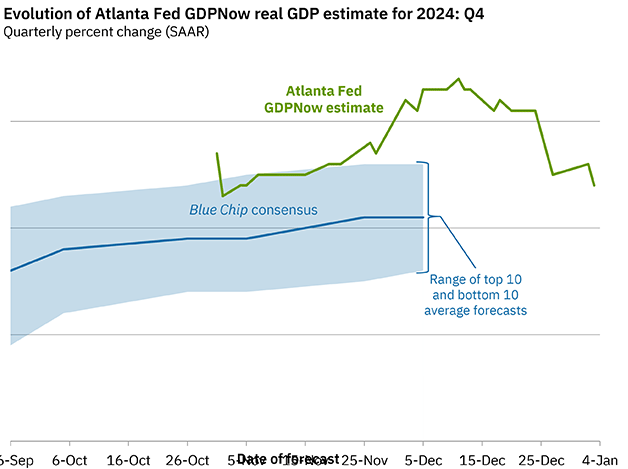
The ISM manufacturing index for December was a better-than-expected 49.3% in December, up from 48.4%. Meanwhile, the Atlanta Fed GDPNow tool is estimating Q4 GDP growth of 2.4%. The estimate fell from a peak of 3.4% on 11 December. The Blue-Chip Economic consensus forecast has ranged around 2.1% (see chart below). The Fed believes that the non-inflationary growth rate for the economy is 1.8%. It is forecasting GDP growth of 2.5% for 2024. Economic data continues to point toward a strong economy.
The stock market is near all-time highs.
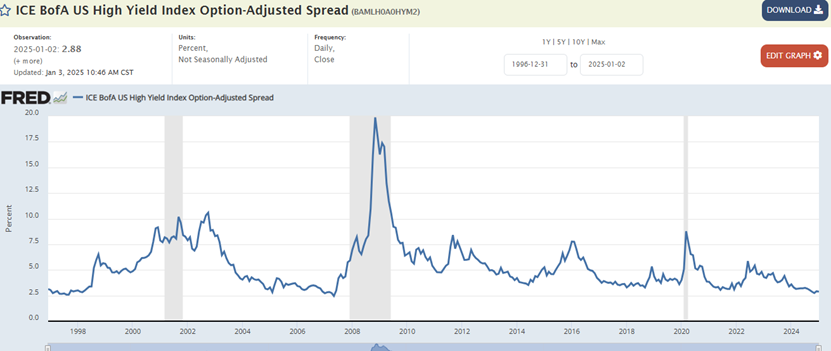
Corporate bond spreads are near record tights. (see chart below)
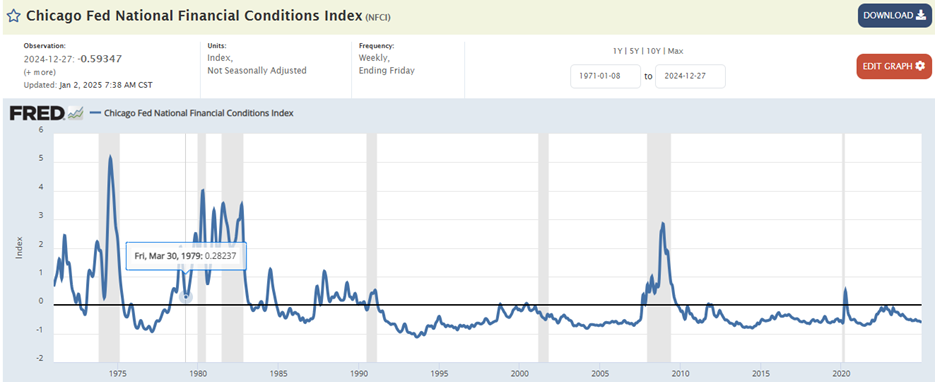
Liquidity is abundant. (See chart below. A negative number means financial conditions are looser than average)
There are no signs of a recession. The Fed is backing away from aggressive rate cuts. Its latest Summary of Economic Projections suggests two cuts in 2025 instead of four. The Fed now seems to realize inflation is proving harder to subdue than expected.
There's a growing likelihood of only one or even no rate cuts in 2025. The SOFR 12-month generic futures contract is trading 30 bps below the midpoint of the Fed Funds rate, according to Mott Capital. SOFR stands for Secured Overnight Financing Rate. It has replaced LIBOR as a measure of overnight lending rates. The 12-month futures contract tells us that investors expect only one rate cut from the Fed in 2025.
"People who listened to Powell at the press conference walked away thinking there might not be any rate cuts next year," wrote Wolf Richter after the Fed meeting. "Powell gave some the impression that the “recalibration” phase of the Fed’s monetary policy was already finished after only 100 basis points in cuts," Richter added in his note to clients.
Richter also wrote recently:
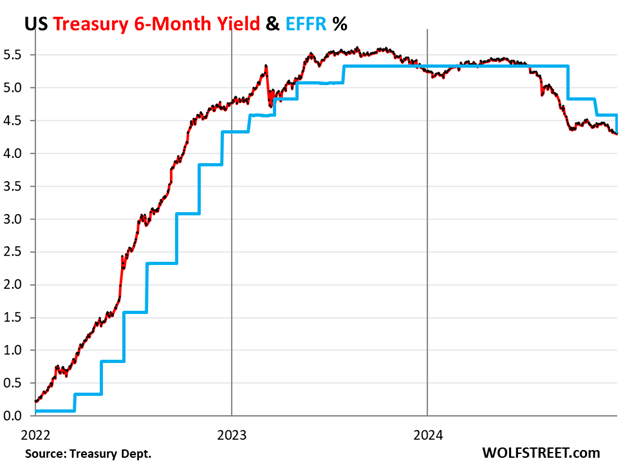
“On Friday, December 13, the yields of 1 to 6 months were all at 4.30% to 4.33%. And that’s where they also ended up on Friday, December 20 after the Fed meeting. And they’re now right at the Effective Federal Funds Rate (4.33% after the rate cut), which the Fed targets with its policy rates. The 6-month Treasury yield sees no rate cut within its window. It had priced in each of the three rate cuts about two months in advance (see the chart below).
Short-term yields stayed roughly the same during the week following the Fed meeting. Everything from the 1-year yield and longer rose. At the long end, the 10-year yield rose by 12 basis points to 4.52% and the 30-year yield rose by 11 basis points to 4.72%.
A Fed rate hike in 2025 may not be out of the question. Forward contracts for the 3-month Treasury bill have risen above the 3-month Treasury bill rate. Both the 12-month and 18-month forward rates are trading above the current 3-month Treasury bill spot rate. (see chart below).
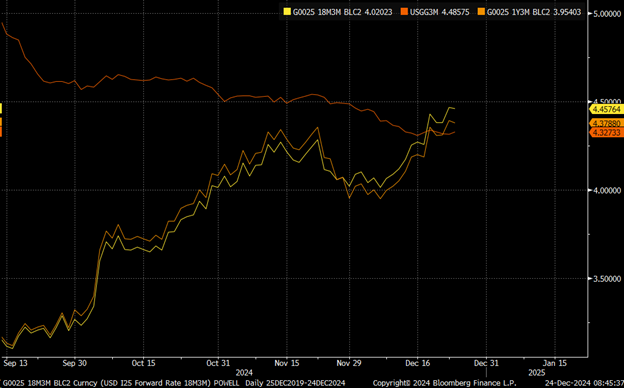
This indicates that the market expects the 3-month Treasury bill rate to be higher 12 to 18 months from now than today.
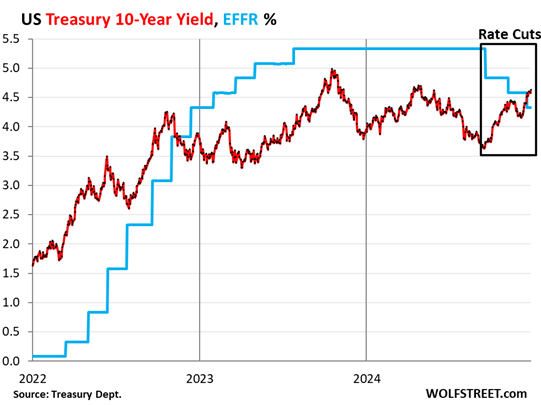
That this rate-cutting cycle is unusual is becoming clear. For instance, it is the first time in 40 years that the start of a rate-cutting cycle brings such a large increase in US 10y yields. (see the chart below).
Inflation concerns are re-emerging. The Fed acknowledged after its last meeting that inflation wasn’t falling as fast as expected. Powell at the press conference said that the rate cut had been a “close call.”
Fewer fed funds rate cuts and higher long-term rates might lead to more volatility in 2025. A rate hike could set off a stock market correction. Felix Zulauf of Barron’s Roundtable fame sees a correction in 2025. He believes it will be a buying opportunity though. Zulauf expects the market to continue higher in 2025 after the correction. He expects new all-time highs later this year. Fair warning though. He also expects 2026 to be an ugly year as earnings disappoint and liquidity dries up.
Nerd Note:
The liquidity dries up part needs an explanation. Unfortunately, it’s complicated. The upshot is that around $2 trillion in money that was being held in the reverse repo market isn’t anymore. It’s been injected into the economy by the banking system. The liquidity injection is partly responsible for the big stock returns in 2024.
A second source of liquidity is now coming to the forefront. Per Barron’s: “The drawdown of another Fed liability—the Treasury’s general account, or TGA—will provide more fuel for the markets starting after the turn of the year. The suspension of the federal government’s debt ceiling will end then, which will mean the Treasury will have to draw down its account rather than continue to borrow. As Uncle Sam uses his cash previously stashed away to pay his bills, it gets injected into the financial system.”
2024 in Review
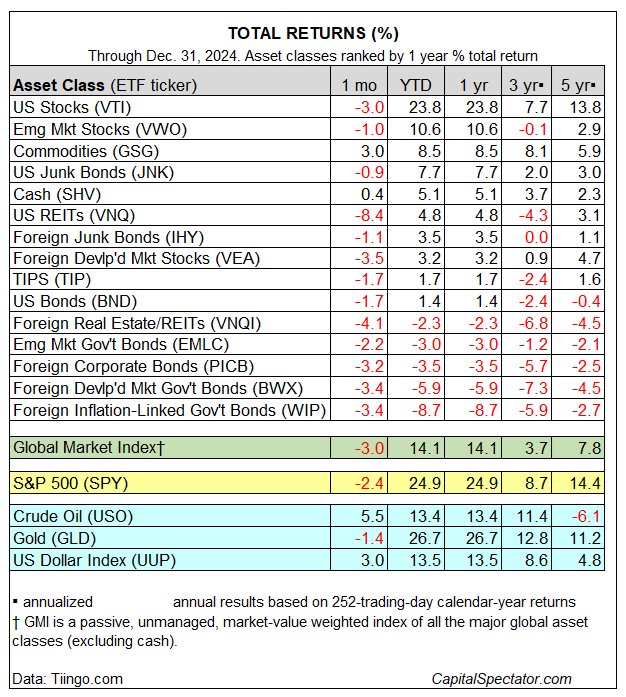
US equities led global markets by a wide margin in 2024. The U.S. stock market was an upside outlier for the second year in a row. The S&P 500 returned 23.3%. The strong gain marks a second straight year of double-digit returns (US equities rose 26.1% in 2023). Meanwhile, bonds had another difficult year. The iShares 20+ Year Treasury Bond ETF (TLT) lost 8.06%. The Vanguard Total Bond Market Index (BND) returned 1.38%.
U.S. stock market returns were once again impacted by a handful of stocks. The Big 6 technology stocks (AAPL, AMZN, GOOG, META, MSFT, and NVDA) posted a 2024 return of 47.5%. The S&P 500 was up 23.8% but only 16% excluding the "Big 6". The "Big 6" made up about 57% of the S&P 500's market-cap gain this year, according to Dow Jones Market Data. The Mag 7 accounted for about 65% of the S&P's market-cap gain in 2023. “Nvidia alone would have reduced the index's return by 5.2% (in 2024) and 10.2% (since October 2022),” Jonathan Golub, chief U.S. equity strategist at UBS, wrote in a note.
Small caps returned 11.5% on the year. International developed market stocks (VEA) returned 3.16%. Emerging market stocks (VWO) returned 10.58%.
Regards,
Christopher R Norwood, CFA
Chief Market Strategist


