

Executive Summary
- The Stock Market dropped 2% last week
- The Dow ended its losing streak at 10
- The Fed cut interest rates by a quarter-point last Wednesday
- Fewer rate cuts could mean slower economic growth and slower earnings growth
- Apollo’s chief economist Torsten Sløk predicts a 40% chance of Fed rate hikes in 2025
- Value stocks continue to lag growth stocks and the overall market
- Value will make a comeback. It always does.
- History doesn’t repeat itself, but it often rhymes~ Mark Twain
S&P 500 5-day chart
Market Update/Economic Update
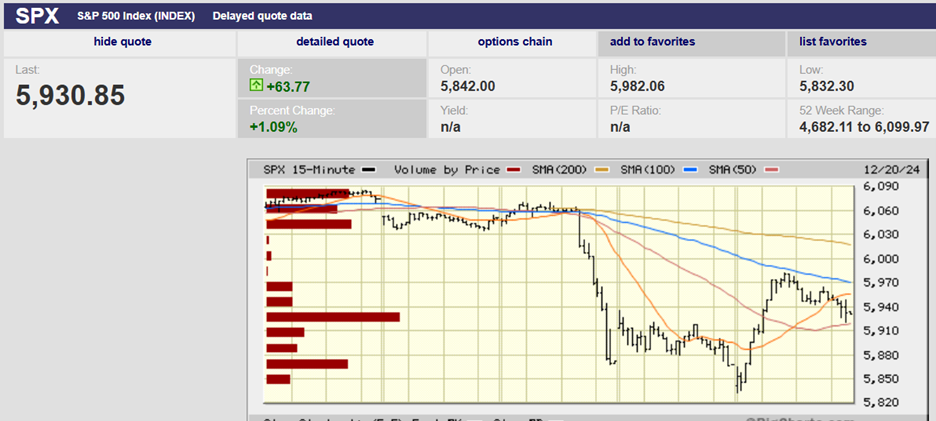
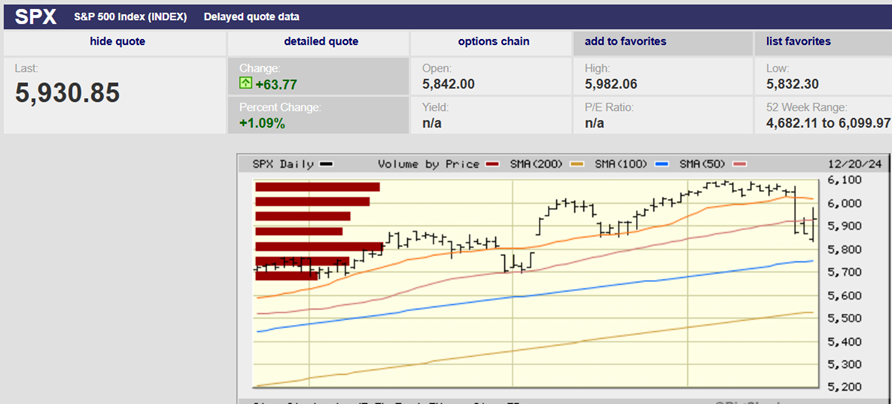
It was an ugly week for the stock market. The S&P dropped 2%, finishing at 5,930.85. According to Barron's, the Nasdaq fell 2.1%, and the Dow lost 2.6% last week. On Monday, the Dow suffered its eighth straight day of declines even as the Nasdaq was hitting a record high. Barron’s wrote that something like that had never happened before. The Dow’s losing streak eventually extended to 10 days. It was its longest since 1974. The losing streak ended Thursday with a small gain for the Dow.
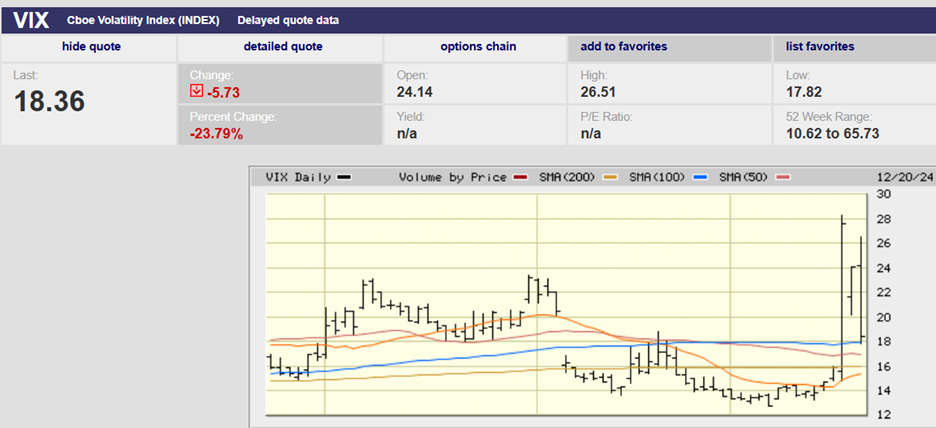
Wednesday was particularly bad with volatility skyrocketing.
VIX 3-month chart
The Fed’s interest rate decision came Wednesday afternoon. The quarter-point cut was expected. The hawkish Summary of Economic Projections (SEP) was not. The blue-chip index sank 1,123 points or 2.6%. The S&P 500 dropped 2.95%. The Nasdaq Composite fell 3.6%. All 11 S&P 500 sectors fell on the same day for the first time since the Aug. 5 market selloff. Wednesday also saw the 12th day in a row where the number of decliners exceeded advancers within the S&P 500. This is the second longest run in 100 years and has only been exceeded by a run of 14 days in 1978, according to Barron’s.
S&P 500 3-month chart
Wednesday the S&P 500 fell below both the 20-day and the 50-day moving averages (see chart above). Thursday and Friday saw a battle between bears and bulls. The S&P gapped up at the open on Thursday to just below the 50-day moving average. It was unable to climb above and maintain. It eventually closed near its low for the day. The setup for Friday was negative given Thursday’s early high and late low. The futures market was signaling an ugly opening Friday morning before the open. The S&P did open down but then reversed, setting the low for the day in the first 15 minutes of trading. The index peaked at noon before giving back some ground. It was unable to retake the 50-day which sits at Friday’s close of 5,930. Monday could see a battle to retake the 50-day moving average and restart the Santa Claus rally. The odds favor a positive finish to the year, given the market’s momentum.
January is uncertain because...
The central bank was even more hawkish with its Summary of Economic Projections (SEP) update than had been anticipated. The September SEP had signaled four rate cuts in 2025. The December SEP is signaling only two cuts. In reaction, the benchmark 10-year yield jumped 9 basis points to 4.50% in afternoon trade. The shorter-end, more rate-sensitive 2-year yield spiked 10 basis points to 4.36%. The two-year yield ended the week at 4.32%. The 10-year yield finished the week at 4.52%.
Fewer rate cuts could mean slower economic growth and slower earnings growth. The Fed’s new forecast acknowledges that the economy doesn’t need short-term rate cuts. The FOMC’s projections see its preferred inflation gauge (the PCE) ending 2025 at 2.5%. That is well above the Fed’s 2% target. "The main takeaway from today’s Fed meeting was that inflation risks are back, and the Fed is concerned," writes Charlie Ripley, senior investment strategist at Allianz Investment Management.
Barron’s summed it up nicely in this week’s edition:
“The economy is growing steadily, faster than the FOMC’s estimate of the economy’s potential of 1.8%. Inflation is above the Fed’s 2% target, while unemployment is at the committee’s estimated long-term equilibrium of 4.2%. Financial conditions remain exuberant, with rich equity valuations and tight credit spreads. And the only near certainty about the new administration’s policies is that they will tend to boost growth and inflation, all else being equal.”
At the same time, the SEP projects real gross domestic product growing by 2.1% in 2025. It had forecasted growth of 2.0% in September. The committee also had to boost its projection for GDP growth in 2024 to 2.5% from 2.0%. And that was before the big upward revision in this year’s third-quarter real GDP growth. Q3 GDP growth was raised to an annualized 3.1% up from 2.8%. The increase was mainly due to stronger personal spending. Also, the Atlanta Fed’s GDPNow fourth-quarter estimate rose Wednesday to 3.2% from 3.1%.
Forget about rate cuts in 2025. Apollo’s chief economist Torsten Sløk wrote Thursday that he sees a 40% chance of Fed rate hikes in 2025 instead.
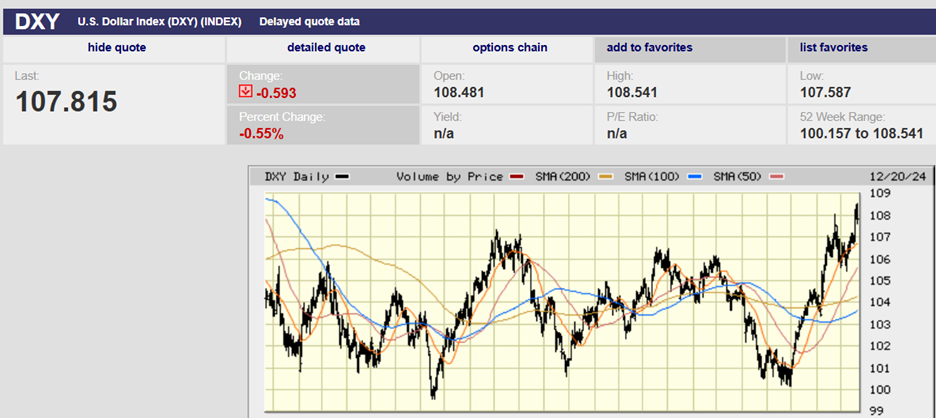
Meanwhile, the U.S. Dollar Index was on pace for its highest close in two years Wednesday. The dollar was responding to the Fed's go-slow rate cut expectations for 2025. The U.S. Dollar Index hit a high of 108.541 Wednesday setting a new 52-week high. The index ended the week at 107.815. Wednesday's close was the highest since Nov. 21, 2022, according to Dow Jones Market Data.
Dollar Index 2-year chart
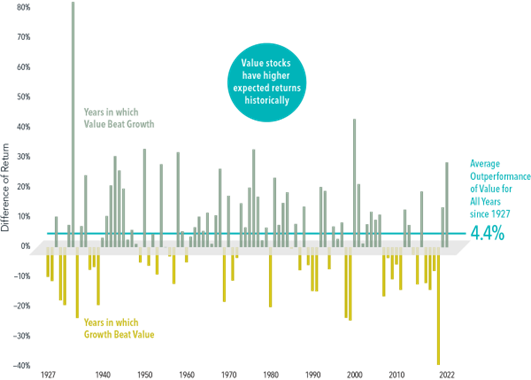
Meanwhile, value stocks continue to lag the market and growth stocks. The Invesco S&P 500 Pure Value ETF (RPV) fell 4% last week. It dropped 7.8% in December, far more than the S&P, which is down 1.7% on the month. The Pure Value ETF trades at 10.1 times 12-month forward earnings. That is well below the S&P 500’s 21.6 times and the Invesco S&P 500 Pure Growth ETF (RPG) 23.8 times. Value will make a comeback. It always does. We wrote last week, “Value outperforms over the long run. The data is conclusive.” We offered up the chart below as evidence last week.
Here is a second chart that shows 10-year rolling returns. The value premium is evident (orange line). The two red areas denote rolling 10-year periods in which growth outperformed value.
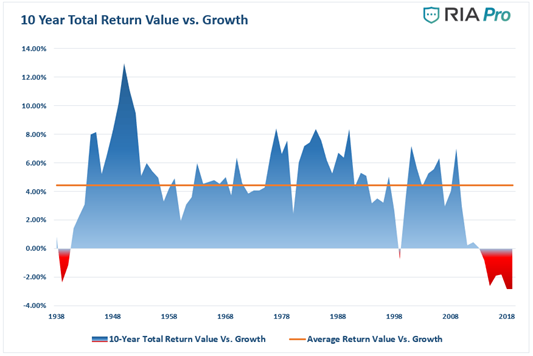
Growth outperformed value during 10-year rolling periods in the 1930s and 2010s. The reason is likely the same for both eras. Extreme economic hardship during the Great Depression and Great Recession led to extreme monetary and fiscal policy. Value will outperform growth once again when monetary and fiscal policy normalizes. Normal will include 10-year Treasury yields around their long-term average of 4.5%. Normal will also include 30-year mortgages between 6% and 7% (about where they are now).
Meanwhile, a broad group of value stocks tracked by SentimenTrader senior analyst Jason Goepfert is near its lowest level versus growth in over two decades. The last time relative prices were at these levels was in the early 2000s. Value stocks went on to outperform growth in the first decade of the 2000s.
History doesn’t repeat itself, but it often rhymes, said Mark Twain. History may be getting ready to rhyme once again.
Regards,
Christopher R Norwood, CFA
Chief Market Strategist


