

Executive Summary
- 50-years of S&P 500 data
- The Dow ended Friday on a seven-day losing streak
- 96% chance the Fed will cut by 0.25% this week
- Stock market strategists are expecting more S&P 500 gains in 2025
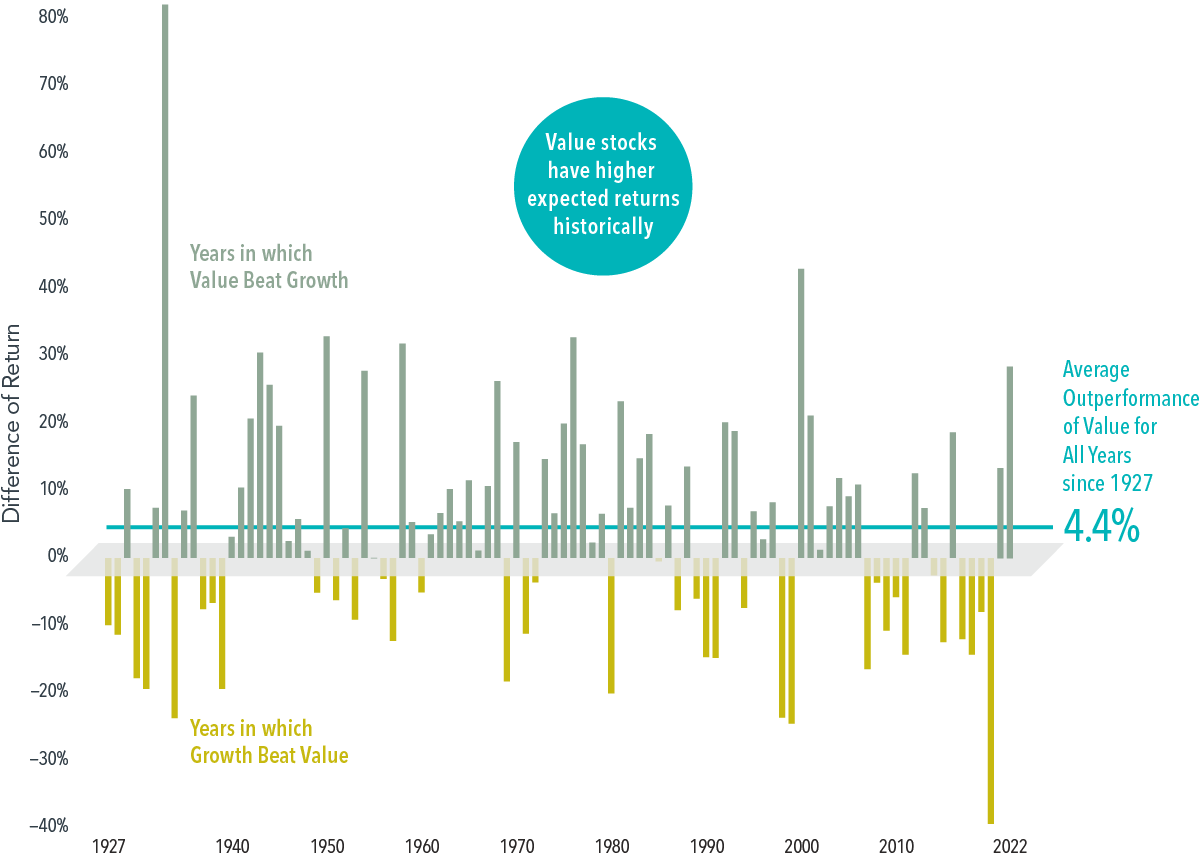
- Value Investing Outperforms over the Long Run
- Value can be found in international and emerging markets today
- Value can be found in the U.S. stock market, but it takes patience
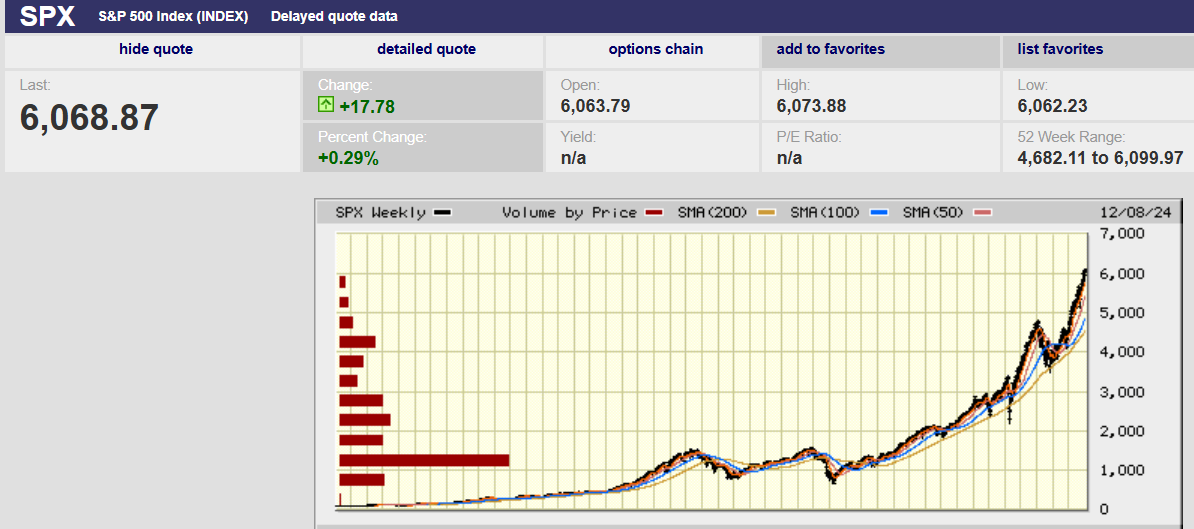
50-years of S&P 500 data
Market Update/Economic Update
The S&P 500 declined 0.6%, and the Dow dropped 1.8% last week. The S&P ended at 6,051.09. The Dow ended Friday on a seven-day losing streak. According to Barron's, most stocks outside of the tech industry have been selling off. More stocks in the S&P 500 fell than rose for 10 straight days through Friday. Dow Jones Market Data shows this is the longest streak since 2000. Declining breadth (participation) is a sign of weakness and can be a predictor of losses to come.
Interest rates rose last week. The two-year yield rose to 4.26% while the ten-year yield rose to 4.40%. There is a 96% chance the Fed will cut by 0.25% this week. Yet, yields are rising along the yield curve. Yields are rising for a couple of possible reasons. This year's deficit is projected to exceed $2 trillion, almost 7% of Gross Domestic Product (GDP). Large deficits and rising debt levels mean a bigger term premium. Investors want a bigger term premium to compensate for the increased chance of default. The other possible reason that yields are rising is the increasing likelihood of higher inflation.
The five-year breakeven rate has risen from 1.86% on 10 September to 2.40%. The latest value shows what market participants expect inflation to be in the next 10 years, on average.
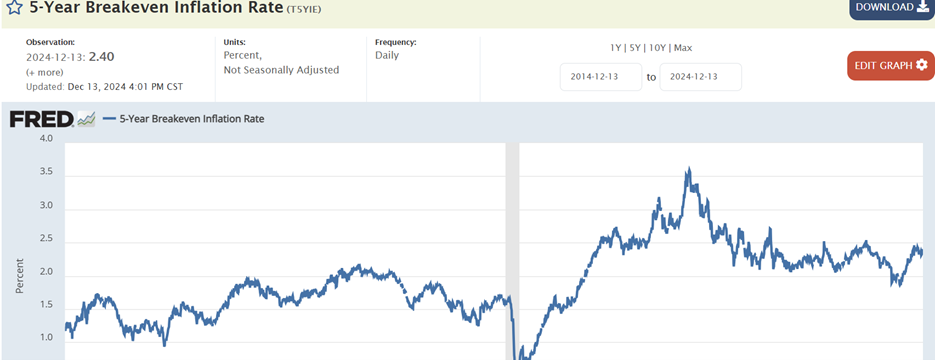
5-Year Breakeven Chart last 10-years
The ten-year break-even rate has risen from 2.02% to 2.33%.
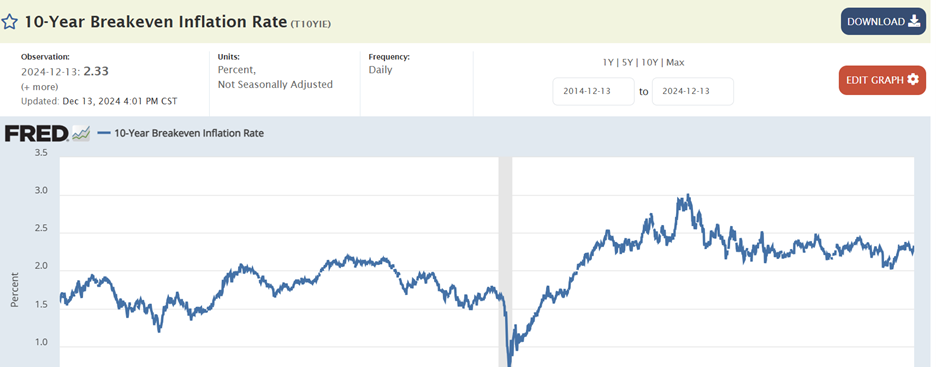
10-Year Breakeven Chart last 10-years
Meanwhile, stock market strategists are expecting more gains in 2025. Market strategists, on average, predict that the S&P 500 will rise to around 6500 by the end of 2025. That’s a 7% gain from a recent 6060, according to Bloomberg data. More than half of strategists have targets between 6500 and 6700, according to Barron’s. Wall Street is looking for S&P 500 earnings to grow by 15% next year, to $273.25, according to FactSet data. The S&P 500 at 6,500 would be trading at almost 24x 2025 earnings. The long-run average is 16.5x earnings.
The U.S. stock market has gained more than 20% two years in a row. Of course, the S&P 500 was down almost 19% in 2022. The likelihood of another 20% plus year is low. Still, over the past 100 years, the stock market was more likely to gain 10% to 20% per year than 0% to 10%, according to Deutsche Bank. Stocks gained 20% or more 39% of the time while logging negative returns 26% of the time. The S&P 500 has gained 20% or more in consecutive years three times in its history. It happened in 1936-1937. The following year saw it fall by 39%. Back-to-back 20% plus gains happened again in 1954-1955. The stock market was up 2.6% in 1956. It also happened in 1995-98 when the S&P gained more than 20% four years in a row. The following year, 1999, saw the S&P just miss a 20% gain. Then came 2000-2002, during which the S&P lost around 50%.
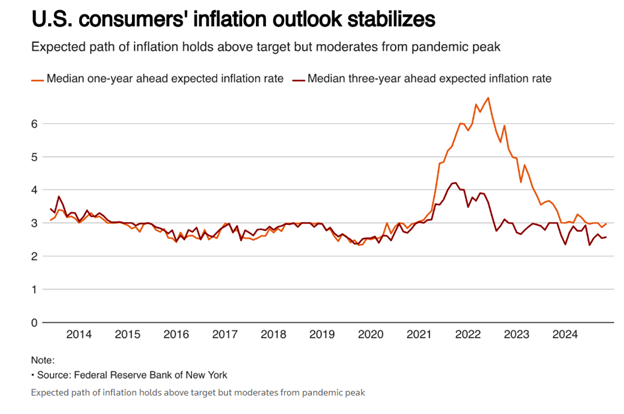
It's not only market strategists who are bullish. The public is expecting the gains to continue as well. Jim Reid, Deutsche Bank’s head of multi-asset research, wrote last week that U.S. consumers are more bullish on stocks than they've ever been. He cited the Consumer Conference Board’s polling. Consumer's expectations for equities relative to their incomes have also never been greater. Strategists point to AI, deregulation, and lower taxes as catalysts for continued gains. Not everyone is quite so sanguine though.
An excerpt from Barron’s
Peter Berezin, chief global strategist at BCA Research, notes that Trump’s tax cuts didn’t lead to increased capital spending during his first term, and he expects that to be the case again. What’s more, the possibility of a trade war could lower corporate spending and hit consumers hard. “We’re on a path to recession regardless,” says Berezin, who has a Street-low target of 4450 on the S&P 500.
Then there is the Federal Reserve and its rate-cutting campaign. Most economists believe that the neutral funds rate is around 3.5% (a rate that doesn’t impact the economy). The Fed’s current dot plot suggests it sees the neutral rate at 3.0%. The fed-funds rate is still at 4.50% to 4.75%. The Fed has some cutting to do based on the neutral rate guesstimate. ING’s chief international economist James Knightley expects the Fed’s Summary of Economic Projections (SEP) released next week will likely include only three rate cuts in 2025. Currently, four are projected. A data-dependent Fed shouldn’t be cutting at all.
Value Investing Outperforms over the Long Run
We are in the part of the stock market cycle in which many people start chasing performance. They want to own what is going up the fastest regardless of fundamentals. They don’t think about what a business is worth. They don’t even think about a stock as ownership in a business. We are starting to see extremes. Barron’s pointed out in this week’s issue that there is a “fartcoin” in cryptocurrency circulation now. The magazine relayed that fartcoin’s market value totals $564.84 million as of this past Thursday. That’s greater than 38% of all American publicly traded companies.
Stocks are ownership in businesses. Valuation determines return in the long run. Ownership of a stock is a claim on owner’s earnings. It makes sense that the more you pay for those future earnings the lower your return. Conversely, the less you pay for those future earnings the higher the return.
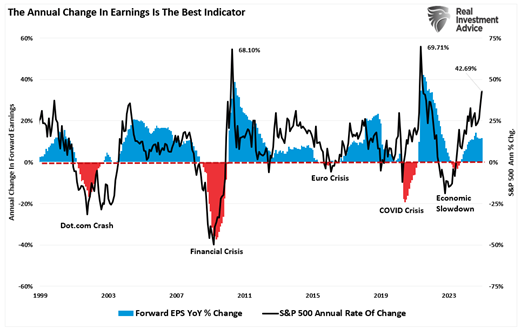
The annual rate of change in earnings helps predict stock market direction over shorter periods. The S&P 500 annual rate of change (chart below) is outrunning the forward year-over-year rate of change in earnings.
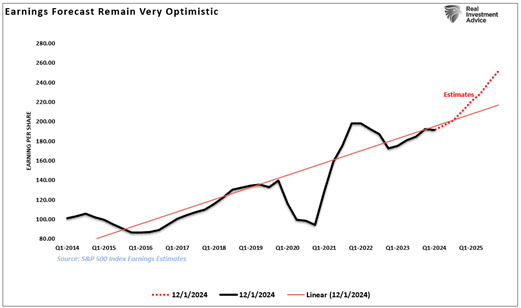
Earnings growth is expected to be 15% in 2025, according to FactSet, which is well above trend (chart below).
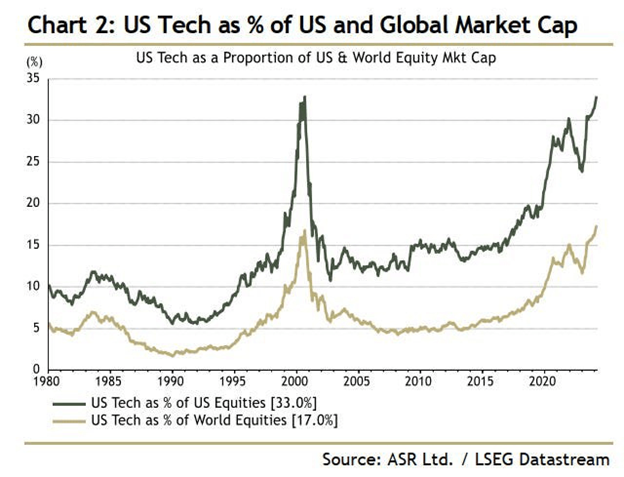
U.S. technology is dominating the stock market and earnings landscape.
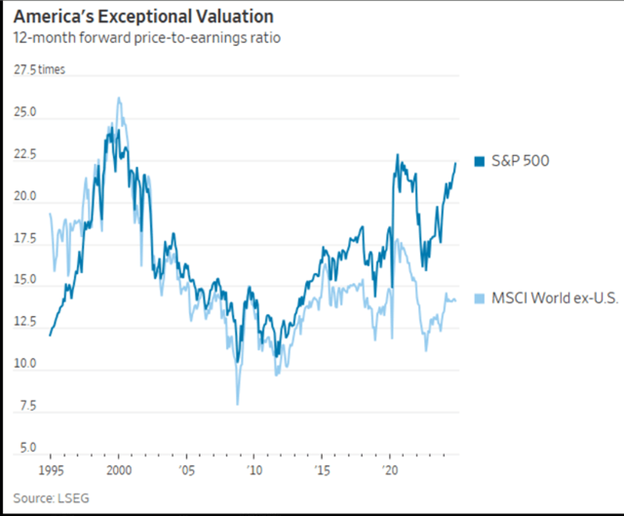
Tech earnings growth will need to remain robust for the stock market to make the expected gains in 2025. The U.S. price-to-earnings ratio is much higher than the rest of the world’s (chart below). Expectations for earnings growth are high for U.S. companies. That explains the high P/E ratio.
Value outperforms over the long run. The data is conclusive.
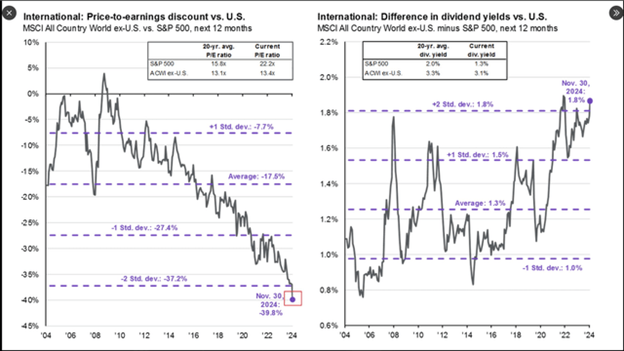
The chart below is busy but it tells an important story. Value can be found in international and emerging markets today. (chart below). The price-to-earnings discount (left chart below) for international stocks is as large as it's been going back 20 years. The dividend yield difference between U.S. and international stocks is near 20-year highs (right chart below).
Value can also be found in the U.S. stock market, but it takes patience. Value investors continue to lag the S&P 500 for now. Last week, famed value manager Bill Nygren was shopping for razor blades. A drugstore employee recognized him from TV and approached him, according to Barron’s. “He says, ‘I bet your portfolio isn’t up as much as mine. I have everything I own in Bitcoin,” Nygren recalled. “And, you know, he’s right. My portfolio isn’t up as much as his.”
Nygren’s time will come. Value investing’s time will come, as it always has in the past.
Regards,
Christopher R Norwood, CFA
Chief Market Strategist


