

Executive Summary
- Jobless claims report higher than forecast
- The Cboe Volatility Index (VIX) fell to 12.77, that's low
- Why is the Fed cutting at all?
- The S&P likely to finish the year above its current level
- The 10-year & 2-year Treasury yield are falling
- The Fed continues cutting despite a strong jobs market and high inflation
- Investors should look at the “low-flyer” companies that represent better value
- Mental Accounting and Risk
S&P 500 5-day chart
Market Update/Economic Update
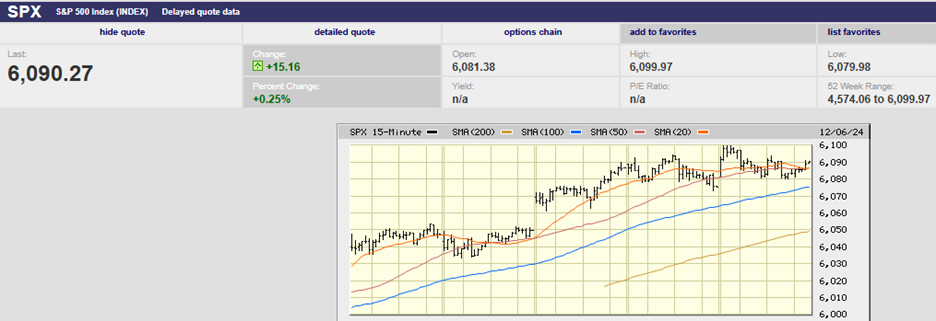
The S&P 500 rose 1% last week to finish at 6,090.27. The index traded flat on Monday and Tuesday. It gapped up at the open on Wednesday, finishing near its high for the day. There was no major economic news out Wednesday though to account for the move. The initial jobless claims report did come out Thursday. Claims rose to 224,000, above the 215,000 consensus forecast. The S&P gave back some of its Wednesday gains on Thursday as investors waited for the Friday jobs report.
The nonfarm payrolls report was released Friday. Payrolls rose 227K. The consensus was 211K. The unemployment rate rose to 4.2% from 4.1%. The index gapped up at the open as investors bought the payroll report. The financial media pointed to the uptick in unemployment as a sign the Fed would cut in December. The S&P peaked early on Friday and then started giving back gains. The index reached a high of 6,099.97 in the first 30 minutes. It bottomed out at 6,079.98 at 12:30 and again at 2:15. It held the lows from both Wednesday and Thursday. That is a small positive heading into the coming week of trading.
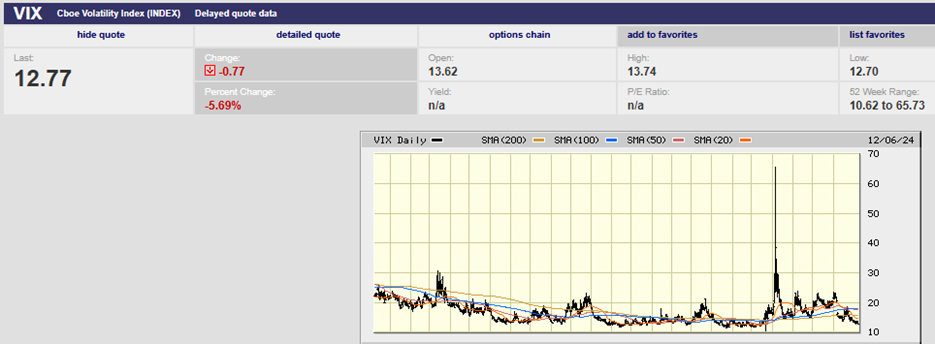
Still, the initial positive reaction followed by some selling shows investor indecision. We could have some volatility in the next few weeks. The Cboe Volatility Index (VIX) fell to 12.77 on Friday. It’s not often that volatility falls that low. Periods of low volatility are always followed by periods of high volatility.
Cboe Volatility Index (VIX) 2-year chart
San Francisco Fed President Mary Daly summed up the jobs report by saying, “the labor market remains in a good position." Carl Weinberg, chief economist at High Frequency Economics agrees. He put out in a note Friday that, “the employment data show incomes growing at a healthy 5% annual clip.” He pointed out that average hourly earnings show 4% annual growth. Wage growth of 4% will make it hard for inflation to fall to 2%.
Fed Gov. Michelle Bowman opined this past week that it’s “hard to think that interest rates are restrictive now.” The capital markets agree. They are signaling easy financial conditions. The stock market is setting records. Corporate bond yield spreads are at historic lows. Bitcoin has topped $100,000 and gold is up around 30% year-to-date (and setting records of its own).
All of which begs the question, “Why is the Fed cutting at all?”
The Consumer Price Index (CPI) report is released on Wednesday. The Fed announces its interest rate decision on the 18th of December. Perhaps one or both of those events will lead to increased monetary policy clarity. They might also lead to higher volatility. Still, it is more likely the S&P continues to trend higher. The 20-day is at 6,000. The 50-day is at 5,850. The 200-day is around 5,480. The S&P is likely to finish the year above its current level. There is talk that investors will wait until early next year to start locking in gains. Maybe we’ll see increased volatility in January. Certainly, we should see increased stock market volatility sometime in 2025. Right now, though the stock market has momentum. The up trend is firmly in place. We are in one of those periods in which investors buy without regard to valuation and the market keeps grinding higher as a result.
Meanwhile, the 10-year Treasury yield continued to fall, ending the week at 4.15%. The 2-year yield finished the week at 4.09%. Rates have been dropping since around Thanksgiving. The two-year and ten-year yields were around 4.4% a few weeks ago.
Investors face a contradiction going into 2025. They expect the Federal Reserve to cut interest rates and for U.S. businesses to boost profits. One of these expectations has to be wrong, according to analysts at financial-services firm Societe Generale.
“Historically, when U.S. interest rates are cut by the extent expected by markets next year, U.S. profits decline by 10%, yet the consensus is for 15% EPS growth next year!” Andrew Lapthorne, analyst at Societe Generale, said in a November 30 report.
Slowing inflation means reduced sales growth, Lapthorne wrote. “And because costs are slower to adjust than prices and volumes, margins decline as sales growth slows. The choice for 2025 then appears to be strong profits growth and therefore less rate cuts or the other way around, but it’s hard to envisage both!” Lapthorne concluded.
Economists at Nationwide recently lowered their predictions for rate cuts in 2025 from 125 basis points to 75 bps, with cuts likely on hold until the spring according to Oren Klachkin, a financial market economist with Nationwide.
The FedWatch Tool has the odds of a rate cut in two weeks at 85.1% currently. The futures market sees the funds rate at 3.75%-4.00% by year-end 2025. The funds rate is currently 4.50% - 4.75%. Taken together it means investors are looking for a quarter-point cut in December and two more cuts sometime next year. The Fed will update its Summary of Economic Projections (SEP) at the December meeting. The current SEP implies a funds rate of 3.25% - 3.50% by year-end 2025. The Fed will likely bring itself in line with the markets when updating the SEP later this month. A slower path of rate cuts seems in the cards. How that impacts the economy is yet to be seen.
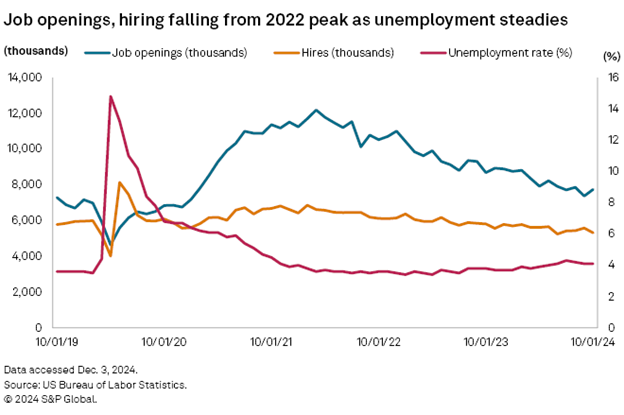
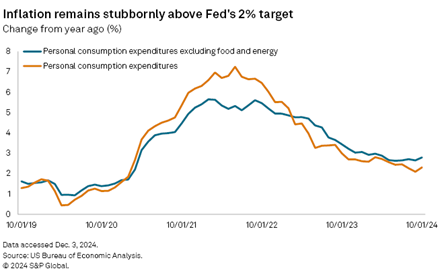
The Fed is cutting despite a still strong jobs market and inflation that is no longer falling. The unemployment rate (red below) is about where it was in 2019. The Fed started cutting rates in July 2019. It was the first cut in eleven years and was made in response to a global slowdown and weak inflation. Now there is no evidence of a slowdown in the U.S. economy and inflation is still well above target.
Meanwhile, the core PCE (blue line below) is flat at best and might be turning up.
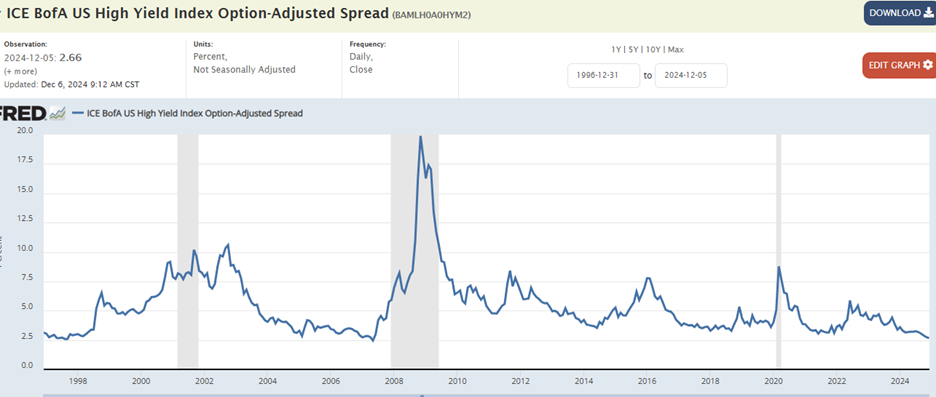
There is plenty of liquidity in the economy. Tight spreads point to a healthy credit market.
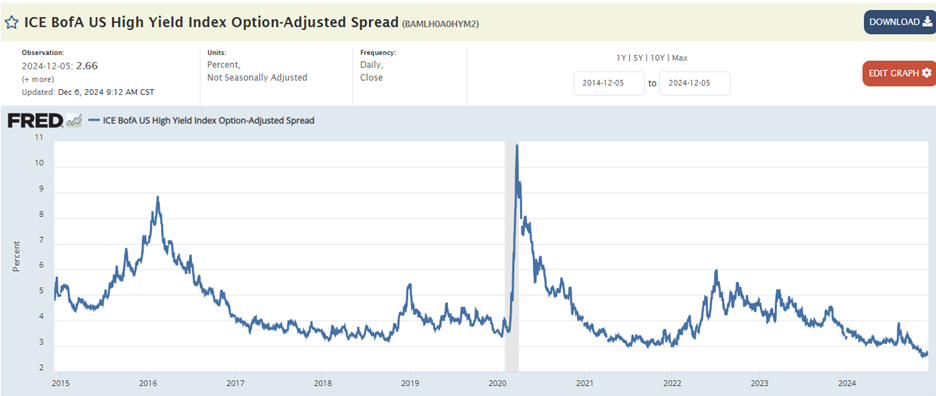
Spreads haven’t been this tight since 2007.
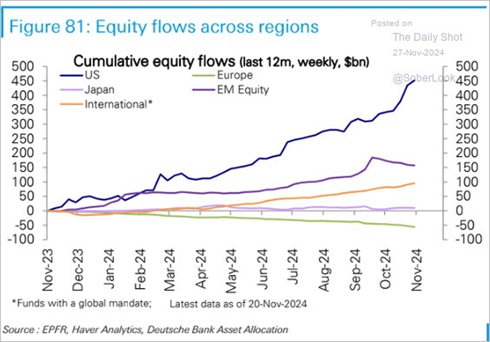
Equity flows into the U.S. continue to surge.
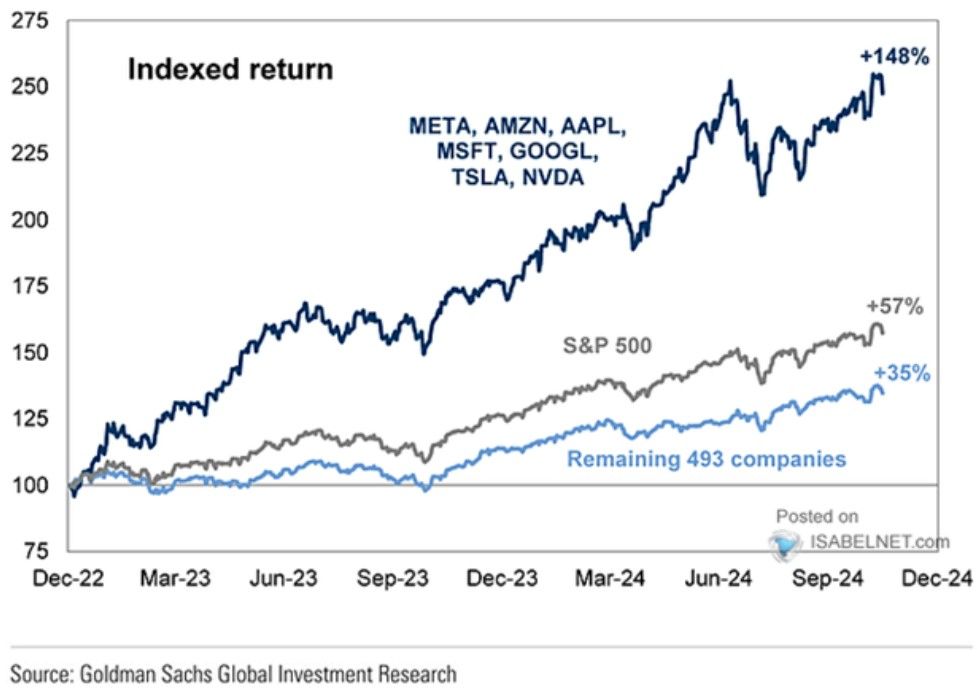
The S&P 500 is trading at 22x 12-month forward earnings. It is expensive. The “Not-so-Magnificent 493” isn’t particularly expensive though. Their gains have been more subdued since the fall of 2022. Investors might want to stop chasing the handful of big tech names that have accounted for the bulk of the gains over the last few years. Instead, look at some of the “low-flyers” that represent better value.
Mental Accounting and Risk
Mental accounting is a behavioral economics concept. It describes the tendency to treat money differently based on its source or intended use. This can lead to irrational financial decisions. Mental accounting can cause people to see money as less fungible than it is.
I had a conversation with a 401k participant that illustrates how mental accounting can lead to irrational decisions. They had $6,000 in a savings account for emergencies. They also had about that same amount in credit card debt on which they were paying 21% interest. The credit card debt was the result of unexpected repair work needed on their house. A rational decision would have been to use the savings account to pay off the credit card debt. They had not because they didn’t see the credit card debt as an emergency, even though the debt was the result of an emergency.
More recently I had a conversation with a new client who wants to put about 45% of his IRA in a “safe investment that can’t lose money”. The new client is 47 years old and plans on working for another 20 years. Life expectancy requires planning for another 45 years.
The “safe” bucket would need to be something like a money market fund. His reasoning is an example of mental accounting. He is putting his investment money into "buckets. He wants a “safe” bucket and a “risk” bucket. Never mind that all of the money is for his retirement. Also never mind that he has one risk tolerance level for that one retirement.
I explained to him that it is more appropriate to create a single diversified portfolio. The asset allocation would set the appropriate risk/reward. Our goal is always to earn a real return sufficient to meet all spending goals in retirement. We want to earn that return while taking as little risk as possible. Mental accounting makes it difficult to figure out how much risk we're taking and how much return we can expect.
Regards,
Christopher R Norwood, CFA
Chief Market Strategist


