

Executive Summary
- S&P 500 rose 1.1% in a holiday-shortened week
- S&P 500 gained 5.7% in November, the best month of the year
- Earnings estimates continue to fall
- S&P 500 gains have outpaced earnings growth since 2009.
- The market is expensive as a result.
- An expensive market doesn’t mean a bear market is coming soon
- An expensive market does mean returns for the next decade are likely to be well below average
- The Personal Consumption Expenditure (PCE) index rose last month. First increase in the index since last summer.
- Treasury bonds are considered risk-free. They are not.
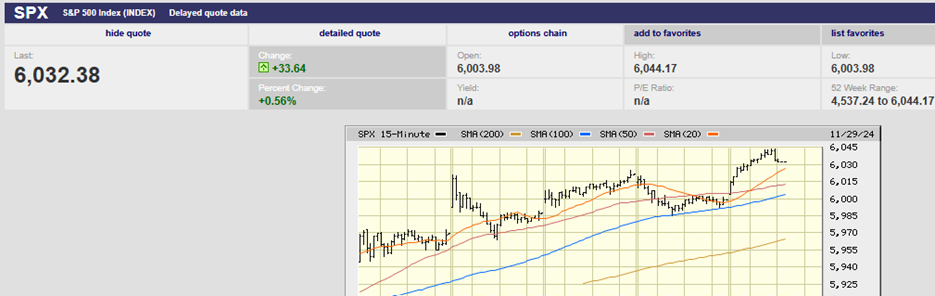
S&P 500 5-day chart
Market Update/Economic Update
The S&P 500 rose 1.1% in a holiday-shortened week. It ended at 6,032.38 Friday during a light volume half day of trading. The index hit a new high of 6,044.17 just before the close. November was a strong month with the S&P gaining 5.7%. It’s now up 26.5% on the year. The value of the underlying businesses does not change as quickly. The S&P 500 touched 3,491.58 on October 13th, 2022. It’s up 72.8% in a little over two years. The S&P fell to 2,191.86 on March 23rd, 2020, during the Covid crisis. It is up 175.2% since then. Most of the gain results from price-to-earnings ratio expansion, not earnings growth. The S&P 500 could fall to 4,500 without jeopardizing the bull market uptrend that began on March 23rd, 2020. It would be a decline of 25%. It would also bring the 12-month forward P/E ratio down to 16.4x, almost exactly the long-term P/E ratio.
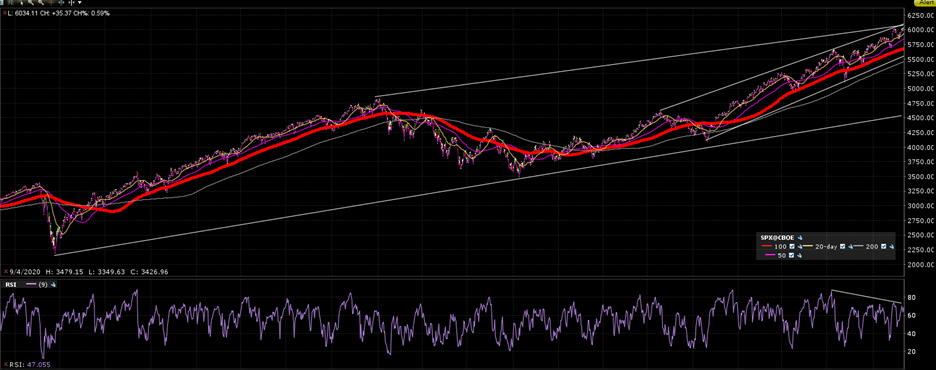
S&P 500 5-Year Chart
The short-term direction for the S&P 500 is up into year-end. The two-year chart shows a couple of multi-month periods of consolidation in 2023. But it’s been an almost uninterrupted advance since November 2023.
S&P 500 Two-Year Chart
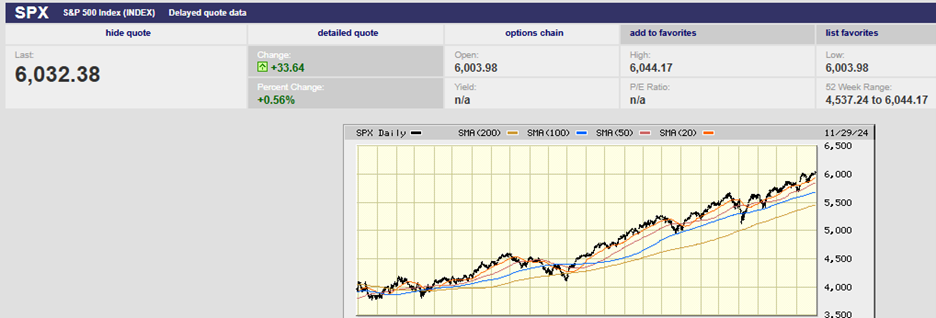
Meanwhile, earnings estimates continue to fall. The S&P 500 earnings forecast has dropped to $243.8 in 2024, 274.8 in 2025, and 309.3 in 2026. That still represents earnings growth of 10.1%, 12.7%, and 12.6%. Earnings growth is unlikely to be in the double digits though. As it is, the S&P is trading at 22x next year’s earnings. Slower-than-expected earnings growth will only make the market more expensive.
The long-run average 12-month forward P/E ratio is around 16.5x. The S&P would need to trade down to 4,534 to return to the average. A decline to 4,534 represents a 25% pullback. Note that we get to the same place whether relying on math or a chart of the S&P 500’s bull market advance.
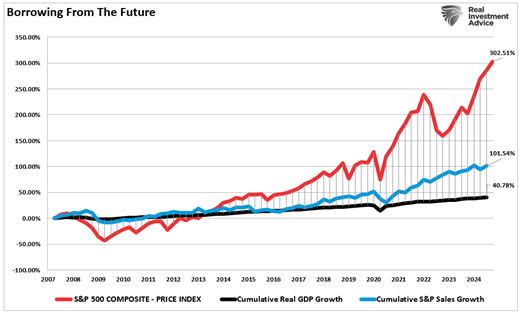
The market is expensive because the S&P 500 gains have far outpaced earnings growth since 2009. We’ve been borrowing gains from the future as the chart below shows.
An expensive market doesn’t mean a bear market is coming anytime soon. Tight credit spreads, low unemployment, loose financial conditions, and muted initial public offerings point towards a continuation of the bull market in 2025. Higher than expected inflation could cause problems for stocks. Higher inflation means higher interest rates. Higher interest rates mean lower stock price-to-earnings multiples. It’s not the most likely case though. Barring a return of inflation or an exogenous event the S&P 500 is likely to add to its gains in 2025.
An expensive market does mean that returns for the next decade are likely to be well below average. The long-term average for U.S. stocks is 9%-10%. Folks planning their retirement based on average long-term returns are likely to be disappointed. Lower than planned returns mean less wealth to meet spending goals in retirement. It might even mean having to cut back in retirement. Best to plan on stock market returns of 3% to 5% in the coming decade. Goldman Sachs is on record as expecting 3% average returns between now and 2034. Morgan Stanley is a bit more optimistic, forecasting 5.7% annual returns over the next decade.
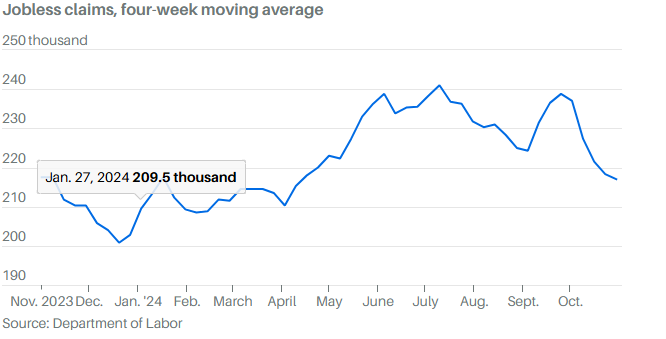
The jobs report is due out Friday. It’s a key report leading up to the Fed’s December meeting. The 12,000 gain in nonfarm payrolls in October was the result of two hurricanes and the Boeing strike. Payrolls are expected to rebound to 200,000. The unemployment rate is forecast to remain at 4.1% for October. The jobs market is still showing strength. Initial jobless claims last week were a low 213,000. The 4-week moving average is a low 217,000. “The overall level of claims is still extremely low by historical standards,” note Carl Weinberg and Rubeela Farooqi of High Frequency Economics. “You have to go back to the 1960s to find a sustained period of similarly low claims. The labor force was a lot smaller then, too.”
The inflation picture is muddled enough to warrant concern. Tax cuts and tariffs are inflationary. Inflation trends are turning unfavorable. The Personal Consumption Expenditure (PCE) index rose last month. The PCE report was released on Wednesday. It was the first increase in the index since last summer, according to MarketWatch. The PCE year-over-year rose to 2.3% from 2.1% (blue). The core PCE year-over-year rose to 2.8% from 2.7%. (red)
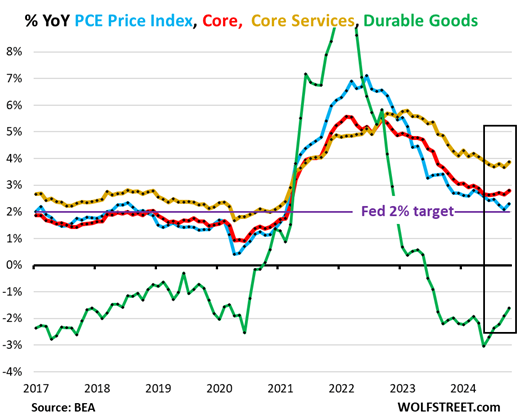
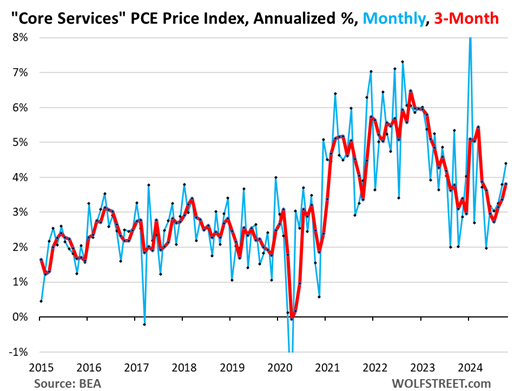
Core Services was the catalyst for higher inflation (gold above). The PCE price index for “core services” accelerated to 4.4% (blue below) annualized in October from September. It was the sharpest increase since March.
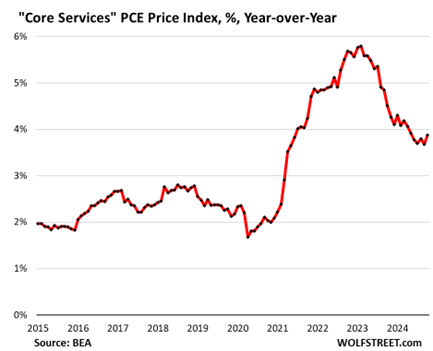
Year-over-year, the core services PCE price index accelerated to 3.9%, the fastest increase since May. There has been no progress since May.
The 3-month core PCE price index accelerated to +2.80% (red below) annualized, the third acceleration in a row, and the fastest increase since April.
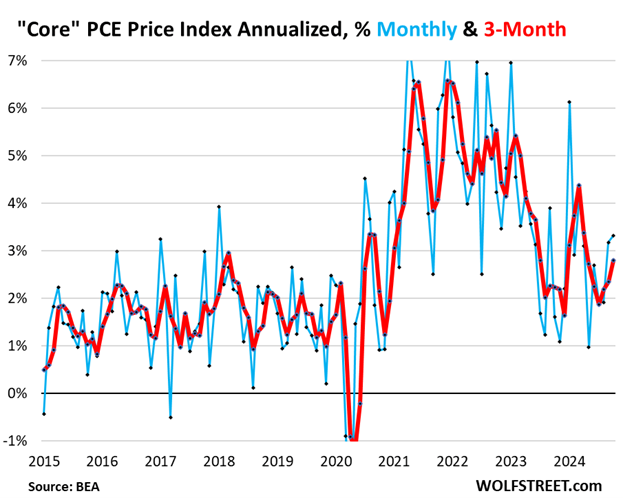
The core PCE also was up at a 2.8% annual rate in the last three months. It was up 2.4% in the three months to September. John Ryding and Conrad DeQuadros, economic advisors at Brean Capital, pointed out last week in a note that there’s been no slowing in the short-term pace in the last few quarters. They further note that the “supercore” services PCE, which also strips out housing, was up 0.4% in October. Fed Chair Jerome Powell had called the "supercore" “perhaps the most important guide to future core inflation." It is moving in the wrong direction.” Its latest year-over-year increase was 3.5%, versus 3.2% in September.
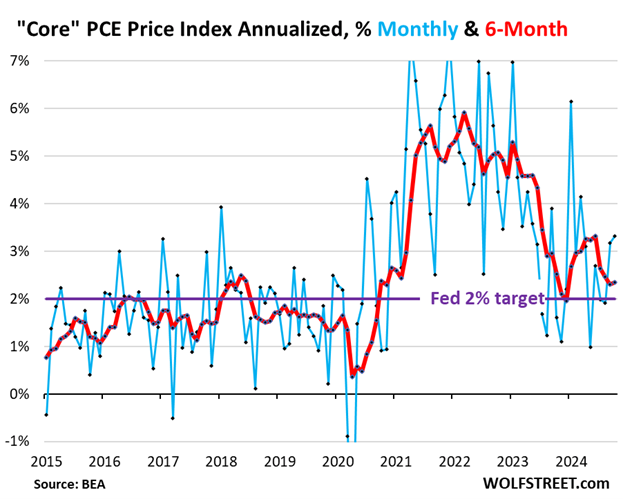
The 6-month core PCE price index accelerated to +2.34% annualized (red below), and has remained higher than at the end of last year:
It’s worth repeating, although not our base case, inflation might reverse higher in 2025. It is enough of a risk that it bears watching as 2024 comes to an end.
Bonds, A Lost Decade
Bonds have been a terrible investment going back over a decade now.
The chart below is the iShares 20+ Year Treasury Bond ETF. Its 10-year return is -0.16%. Its 5-year return is -0.41%. Its 3-year return is -12.07%.
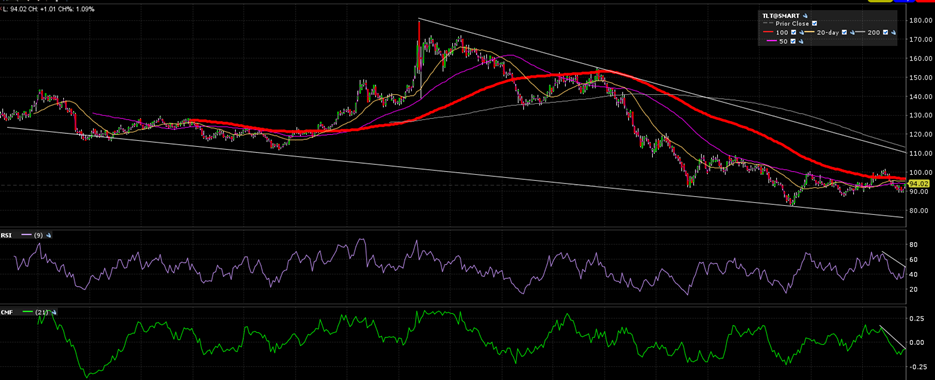
TLT 10-year chart
Treasury bonds are considered risk-free. They are not. Held to maturity they will return the coupon. There is no risk of default. There is interest rate risk though. Interest rates can rise during the holding period causing bond prices to fall. Falling bond prices means selling at a loss if you need cash. Holding bonds that pay a lower coupon than newly issued bonds mean earning below-market yields. The additional yield is a loss as well. It's known as opportunity cost.
Opportunity cost is real. Ask any economist. Investors collecting 3.5% when rates are at 5.5% are losing the opportunity to earn an additional 2%. Banks are sitting on some $512 billion of losses as of Q2 2024. They will be forced to recognize losses if they need to sell bonds due to capital requirements. As it is they are stuck owning Treasuries with coupons of as little as 0.5%. Ten-year Treasuries are yielding 4.17% currently.
Bonds may be a better investment over the next few years. Then again, they may not. There is a real risk that inflation will run hotter than currently forecast. Norwood Economics is exposed to the short end of the yield curve. We have very little exposure to intermediate bonds and no exposure to long-term bonds. Longer-term bond prices are more sensitive to changes in interest rates. That means more interest rate risk. The small amount of extra yield isn’t worth the interest rate risk.
(Consult your financial advisor. Nothing written about bonds is to be considered investment advice.)
Regards,
Christopher R Norwood, CFA
Chief Market Strategist


