

Executive Summary
- S&P 500 rose 1.7% last week
- Leading Economic Index (LEI) declined for the 8th straight month
- Heavy government spending is keeping the economy growing
- The US stock market is expensive relative to other stock markets
- Huge deficits have caused profit margins to widen
- Huge deficit spending isn’t sustainable
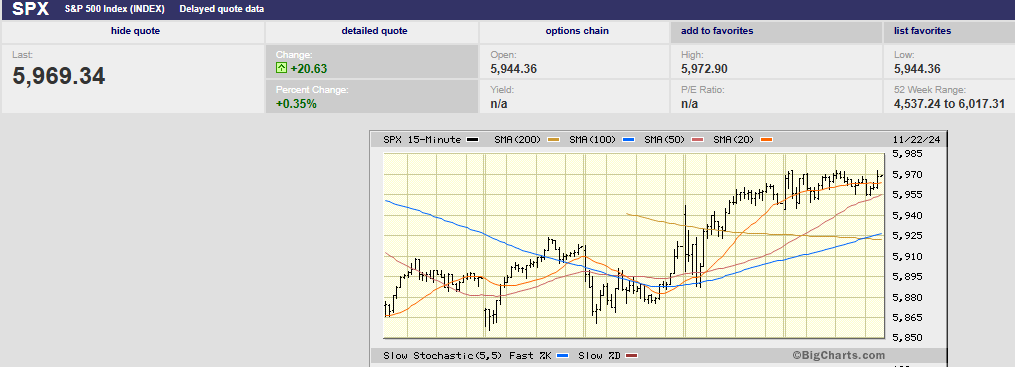
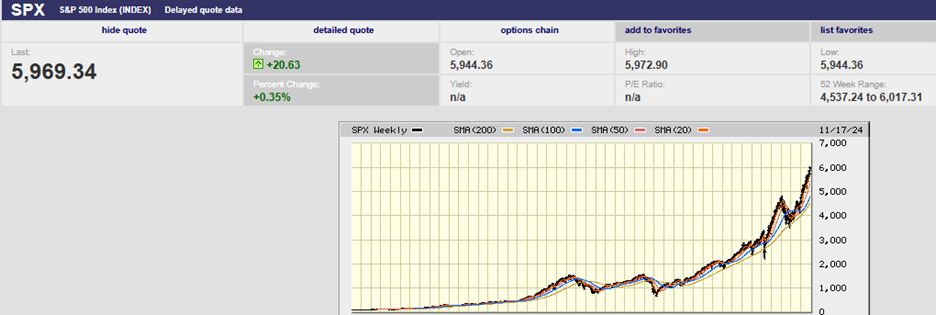
S&P 500 5-day chart
Market Update/Economic Update
The S&P 500 rose 1.7% last week and finished at 5,969.34. Its all-time high came on 11/11 when the index reached 6,001.35 before retreating. The S&P looked as if it was going to decline two weeks in a row by Wednesday morning. It touched 5,855.29 around 10 a.m. but rose from there. The S&P hit a high of 5,963.32 Thursday afternoon around 3 p.m. The total gain from Wednesday’s low to Thursday’s high was 1.8%. The entire gain for the week was 1.7%.
The economic news out Wednesday and Thursday wasn’t market-moving. The leading economic index (LEI) fell 0.3% in October. The index declined for the 8th month in a row. It was the 32nd consecutive month of contraction and the longest since at least 1957. The decline was largely due to higher initial jobless claims, fewer building permits, and a decline in manufacturing orders, according to the Conference Board.
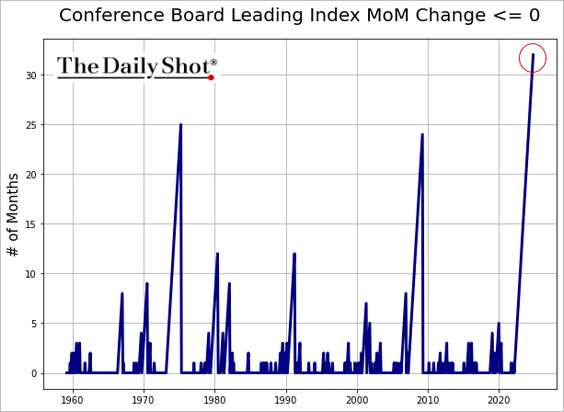
The report was better than the consensus forecast of negative 0.4% and last month’s negative 0.5%. Still, the economy has continued to do fine. The LEI stopped signaling a recession in October, according to the Conference Board. The Atlanta Fed’s GDPNow tool has the economy growing 2.6% in the fourth quarter. It grew 2.8% in Q3.
There was a half-hearted attempt by the media to credit Nvidia’s earnings report for the market’s rise Thursday. The reason given was even less convincing than normal. Nvidia fell in after-hours trading on Wednesday after a disappointing earnings report. The stock traded flat the last three days of the week. NVDA received a rare downgrade from PhillipCapital on Friday. To top it off the Nasdaq only rose 0.1% on Thursday. It seems unlikely Nvidia's earnings report had anything to do with the S&P 500's bounce Thursday.
The initial jobless claims came in better than expected at 213,000 on Thursday. The consensus was 220,000. The claims number was the lowest in 7 months. Claims fell in 37 of the 53 states and territories. The one negative was another increase in the continuing jobless claims. The continuing claims number topped 1.9 million for the first time since the spring of 2018. The 4-week moving average was 1,879,250, an increase of 5,000 from the previous week's revised average. This is the highest level for this average since November 27, 2021, when it was 1,928,000. The continuing claims number bears watching. Initial jobless claims are low but it's taking people longer to find new jobs.
Another measure of the employment market also bears watching. The year-over-year trend in private payrolls less total nonfarm payrolls is usually positive. A positive spread means that the private sector’s hiring tends to dominate. A negative spread signals weakness in the private jobs market. The shift tends to coincide with weak economic conditions that often equate with recession.
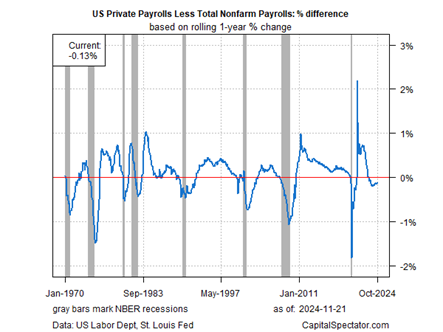
Heavy government spending is the likely reason the U.S. has not fallen into recession over the last year. The federal government is running a 6% plus deficit. Normally, large deficits are the result of a recession or war. Growth in the public jobs sector is helping keep unemployment low.
Investors are expecting another Fed rate cut in December. It’s little better than a toss-up though. The CME FedWatch tool has the odds of a quarter-point cut at 52.7%. The two-year Treasury is moving higher and signaling there might not be a cut in December after all.
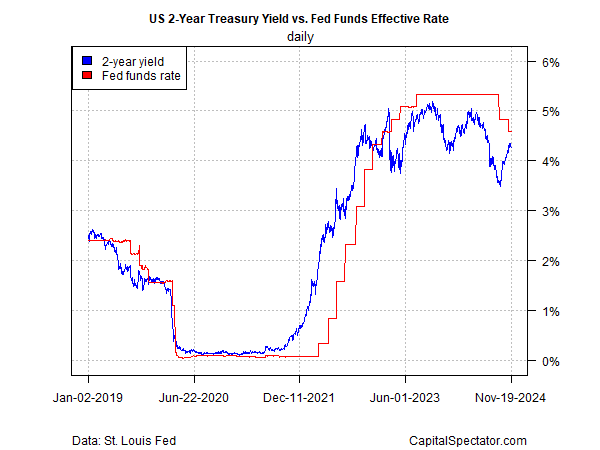
The negative spread between the fed funds rate and two-year has narrowed over the past two months. It is currently a modest -31 basis points. The two-year Treasury most closely tracks the fed funds rate.
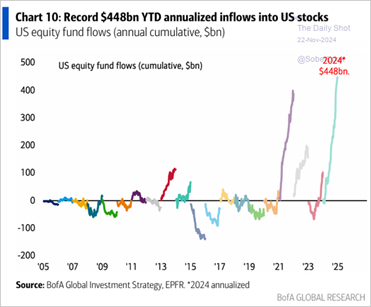
Meanwhile the stock market rally continues to push stocks into rarified air. Tech-heavy US equity funds are attracting record global inflows.
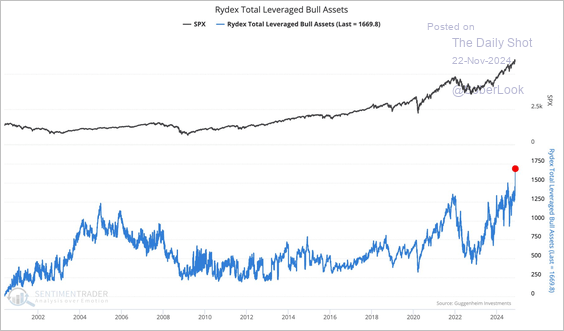
Assets in leveraged security funds are increasing risk exposure. They've taken out the 2022 peak. (Leveraged security funds are the blue line below since 2001 with S&P 500 in black).
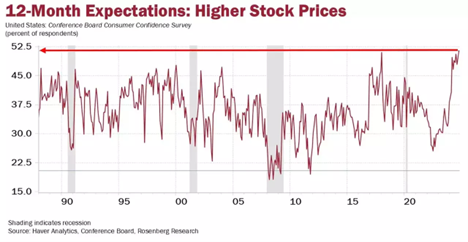
The US stock market is expensive on an absolute basis and relative to other stock markets around the world. The concentration in the US market is at a record as well. The S&P 500 is on track for its biggest election-year gain in 88 years. Despite the big gains in 2023 and 2024, U.S. consumers expect more over the next 12 months. The share of U.S. consumers expecting stocks to rise further has doubled over the last year. It is at the highest percentage since the question was first asked in 1987. That is according to the latest Conference Board Consumer Confidence Survey. (chart below courtesy of Global Macro Investors and Rosenberg Research).
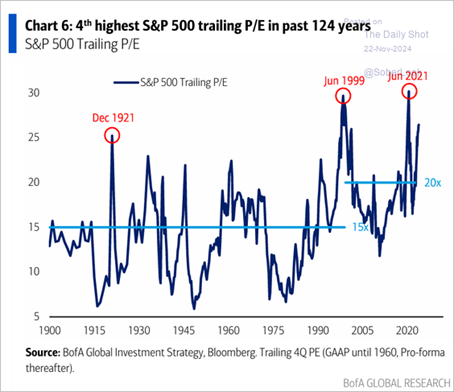
The rush into US stocks has left the market expensive.
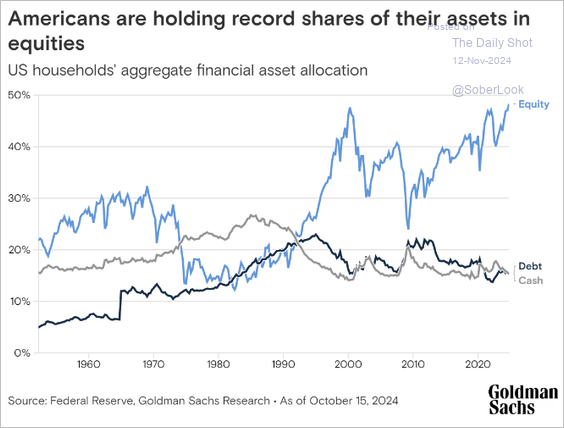
Individual investors are holding a record percentage of their assets in stocks.
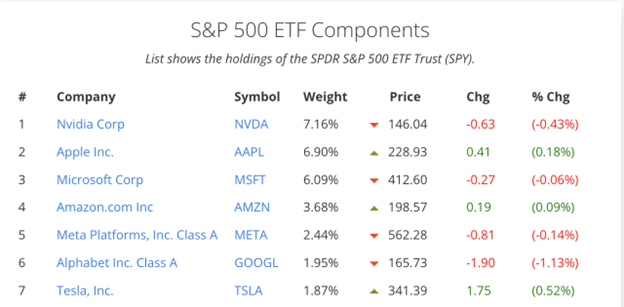
The US stock market is concentrated in a handful of names like never before. Chip leader Nvidia has a market capitalization of $3.6 trillion. It is trading at more than 32 times expected 2025 sales. It accounts for 7% of the S&P 500 price. The top 7 most expensive companies–all in the tech space–account for over 30% of the index value.
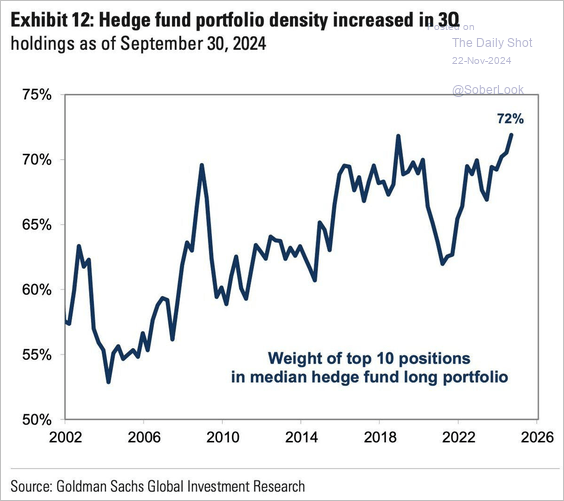
Equity hedge fund managers are also concentrating their portfolios far more than normal.
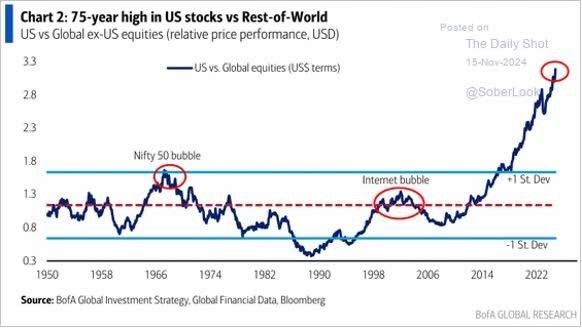
The US stock market is trading way above normal based on its relative value to the rest of the world. (shown below since 1950, courtesy of Bank of America and The Daily Shot). Lesser overshoots in 1966 and 2000 led to secular global bear markets. It took years to recover losses.
The weight of the ten biggest US stocks is the highest since the early 70s. Fifty years ago the US economy was 36% of the world economy. It is around 25% of the world economy today. The US stock market made up a bigger percentage of world markets back then as well. The current concentration exceeds the internet bubble era.
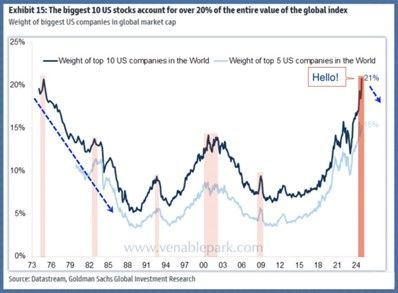
Just 5 US tech stocks account for a record 15% of the global equity market capitalization. (blue line above since 1973, courtesy of Goldman Sachs). That's nearly double the weight seen at the 2000 tech top. The top 10 most expensive US companies account for 21% of global equity market capitalization (black line above).
Company insiders are selling at record rates even as U.S. and foreign investors are buying U.S. stocks.
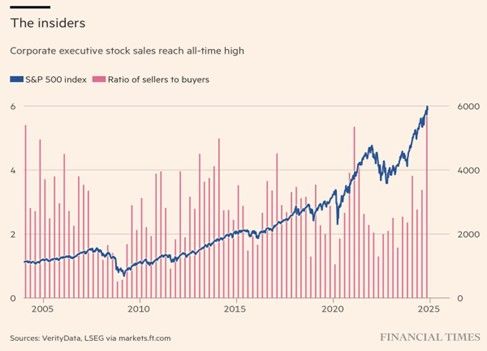
Insiders know far more about their companies than investors do. Perhaps they're trying to tell us something?
Meanwhile, big public companies have hit a sweet spot with margins. They are at record highs. Government spending has much to do with it. Revenue that otherwise wouldn’t exist is flowing to companies, courtesy of the federal government.
Or as Albert Edwards of Societe Generale wrote recently, “But we still emphasize that one of the main sources of the recent surge in profit margins is massive fiscal expansion. In short, the government has been spending more to the benefit of corporates.”

The huge deficits have caused margins to widen, but for how long? Huge deficit spending isn’t sustainable. The total federal budget is around $6.1 trillion. Discretionary spending is around $1.7 trillion. The 2024 deficit was $1.8 trillion. The fiscal 2025 deficit is on pace to top $2 trillion. The interest cost alone is on pace to top $1 trillion. The math doesn’t work. It’s just a question of when it stops.
The bull market since the 2009 low has been about multiple expansion. The S&P 500 has far outpaced economic and sales growth. The chart below shows the failure of the outpouring of liquidity to translate into economic growth. The stock market returned over 300% since the 2007 peak. The increase in asset prices was more than 7x the growth in real GDP. It was about 3x the growth in corporate revenue. The top earners in the U.S. have benefited tremendously from the flood of liquidity since the Great Recession. They are the ones who own stocks and houses after all. The bottom 60% of income earners, those who depend on economic growth to drive wage growth, haven’t done as well. Asset prices should reflect economic and revenue growth. That hasn’t been the case since 2007.
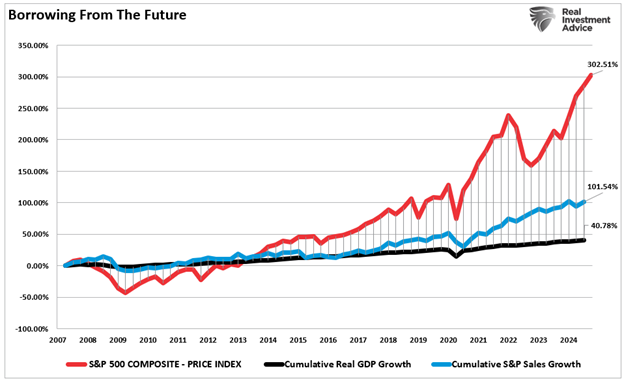
Skyrocketing asset prices are unsustainable. Trees don’t grow to the sky.
Economist Ed Yardeni believes this upward momentum will continue. He has revised his long-term forecast, projecting that the S&P 500 will reach 10,000 by 2029. Yardeni’s analysis is equally striking, even in the shorter term. He anticipates the S&P 500 will reach 6,100 by the end of 2024, with more gains to 7,000 by 2025 and 8,000 by 2026.
Yardeni was right in the late 1990s about the bull market, until he was wrong. He was right again in the oughts as the housing bubble grew, until he was wrong. He’ll be right again about the current bull market, until he is wrong.
Regards,
Christopher R Norwood, CFA
Chief Market Strategist


