History doesn’t repeat but it does rhyme
Christopher Norwood • November 18, 2024

Executive Summary

  • December rate cut odds dropped to 60.2%
  • Odds of rising inflation in 2025 are increasing
  • Stock market is expensive at 21.4x earnings
  • Diversification means owning something other than the S&P 500
  • International markets are trading cheaply
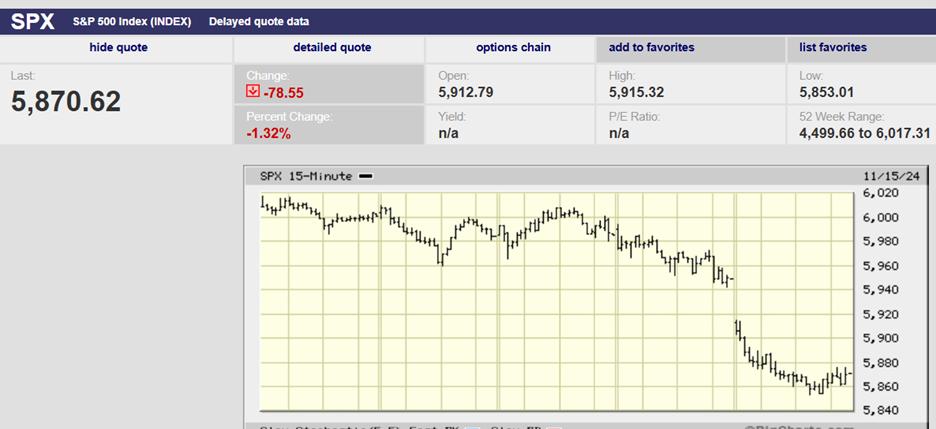
S&P 500 5-Day Chart

Market Update/Economic Update

The S&P 500 lost 2.1% last week. The index finished the week at 5870.62. Last week was the S&P’s worst since September 6th. Barron’s points to traders “once again focused on interest rates.” Odds of a December rate cut dropped to 60.2% according to the CME FedWatch tool. Norwood Economics wrote last week, “It believes continued rate cuts are a mistake. Financial conditions are already loose. The Trump administration plans to pass additional fiscal stimulus in the form of tax cuts. The odds of rising inflation in 2025 are increasing. To make matters worse, more tariffs will add to the inflationary pressures.” On a month-to-month basis, core CPI rose by 0.28% (3.4% annualized) in October from September. The Core PPI for final demand rose by 0.3% last month. Neither report supports more Fed rate cuts.

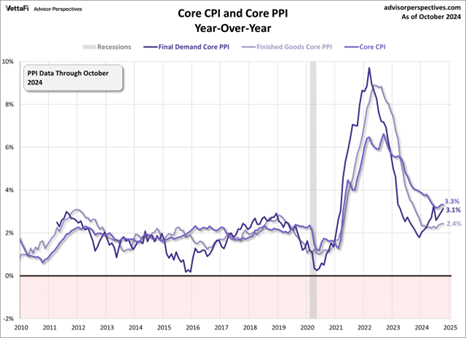
The Inflation rate is no longer falling.

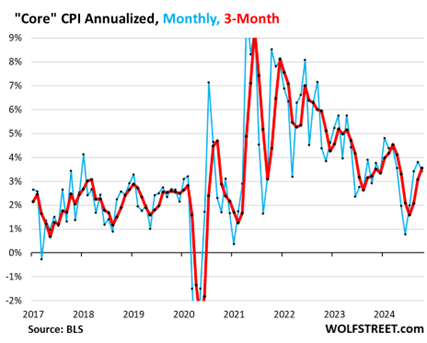
The three-month core CPI is rising.

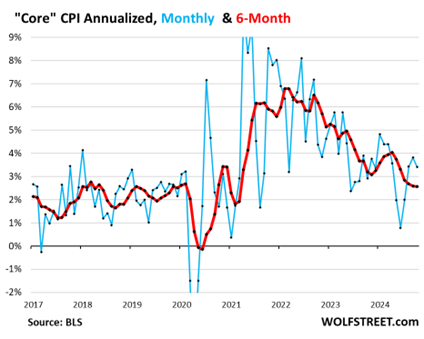
Six-month Core CPI is not rising yet but it’s falling at a decreasing rate.

Meanwhile, the Fed's preferred super core inflation measure rose by 0.31% in October. The super core measure excludes shelter from core services. Wage costs drive the super core measure. The annual rate of increase is 4.4% in October. A super core measure of 4.4% isn't conducive to a 2% inflation rate.


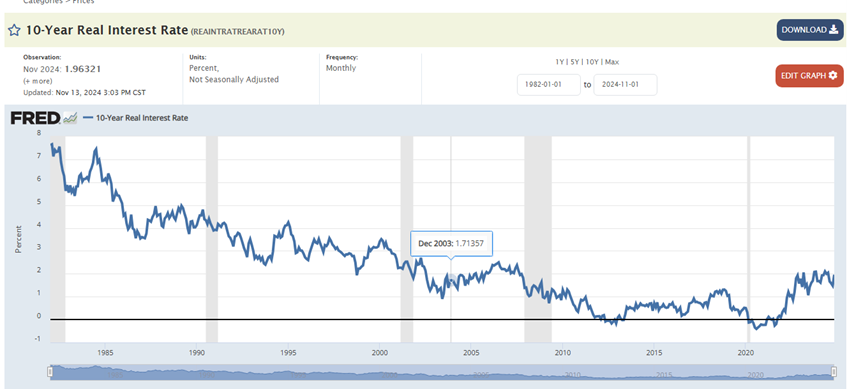
The inflation rate could average between 3% and 5% over the next one to two decades unless changes are made. Monetary policy needs to keep interest rates higher. Fiscal policy needs to reduce deficit spending. The $35 trillion public debt and 6.5% budget deficits make higher inflation likely. The Fed's easy money policy makes higher inflation likely as well. The 10-year Treasury yield will average at least 1% to 2% above the inflation rate if history is a guide. The age of zero real rates is behind us.

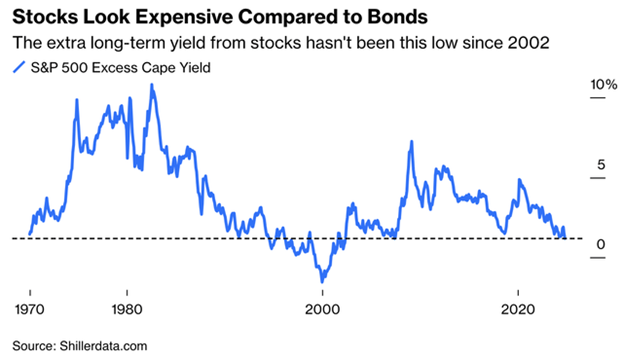
Inflation of 3% to 5% and a 10-year Treasury yield of 4% to 6% means bonds will remain attractive relative to stocks. That is unless the stock earnings yield rises. The S&P 500 has a 12-month forward price-to-earnings ratio currently of 21.4x. The earnings yield is the inverse of price-to-earnings. A P/E ratio of 21.4 equals an earnings yield of 4.7%. The 10-year Treasury yield ended the week at 4.44%. The equity risk premium is currently 0.26%, basically zero. An equity risk premium of 3% to 4% is normal, so an earnings yield of 7.7% to 8.7% would be an appropriate equity risk premium. An earnings yield of 7.7% equals a P/E ratio of 13x.

The stock market is expensive at 21.4x earnings (4.7% earnings yield) when the 10-year Treasury yields 4.44%. There is no margin of safety. The S&P will need to fall to somewhere around 3,700 for the equity risk premium to rise to 3% (4.44% plus 3% equals 7.44%. $274.6 in 2025 earnings divided by 7.44% equals 3,690. And that assumes the 12.7% earnings growth consensus forecast comes to pass. Earnings in 2025 are likely to rise in the single digits, not double digits.

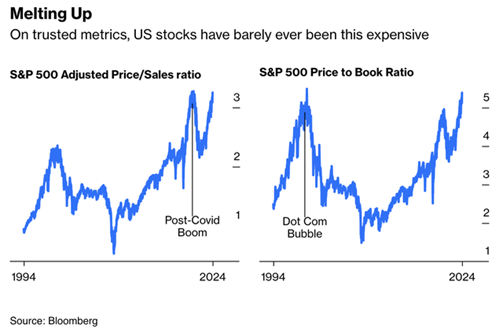
One last observation on stocks and inflation. Stock price-to-earnings multiples contract when inflation rates rise. Stock multiples contract because future earnings are worth less. Future earnings are worth less because inflation reduces the value of future dollars. The price-to-earnings ratio has fallen into the low double digits in the past when inflation rates rise. A multiple of 12x gives us an S&P value of around 3,300. Norwood Economics does not expect the S&P 500 to fall to 3,300 but it is a possibility.


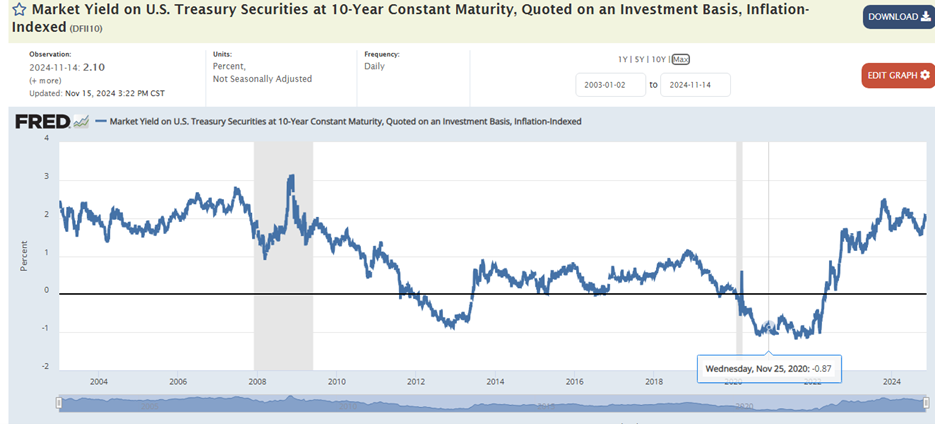
Fortunately, other asset classes are cheaper than the S&P 500. Diversification means owning something other than the S&P 500. International developed and emerging market stocks are cheap. Also, the real 10-year Treasury yield is 1.96%, the highest real yield since before the Great Recession.

U.S. stocks are expensive because they have outrun earnings since the Great Recession.

U.S. stocks have had a great 10- and 15-year run

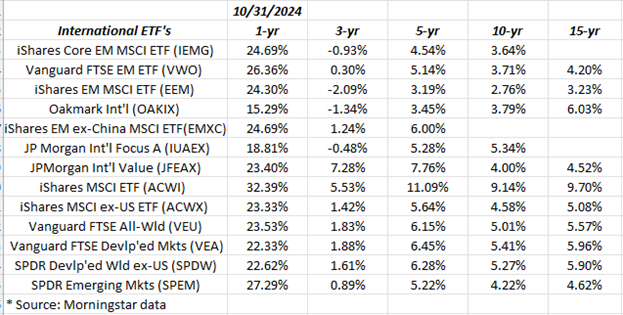
International markets have not done well over the last 10- and 15 years, making them cheap today.

The U.S. market has outperformed international markets by a wide margin. The U.S. market is trading at nosebleed levels. Meanwhile, international markets are trading cheaply. Fifteen years of going nowhere while earnings continue to grow make for an attractive opportunity. International stocks have underperformed U.S. stocks by a historic margin over the last 15 years.


Large-cap growth and tech market topped in March 2000. Money rotated into asset classes that had underperformed in the late 1990s. Value investing, small and mid-caps, and international equities began to outperform. The rally in international stocks lasted for 7 years. Meanwhile the S&P 500 and the Nasdaq fell 50% and 80% respectively between March 2000 and early 2003. History doesn’t repeat, said Mark Twain, but it does rhyme.


Regards,


Christopher R Norwood, CFA


Chief Market Strategist

By Christopher Norwood April 28, 2025
Executive Summary The S&P 500 rose 4.6% last week and finished at 5,525.21 Dollar weakness is an unpleasant surprise Tariffs and the dollar's safe-haven status should have pushed the dollar higher The S&P managed to retake the 20-day moving average Investors are looking for a reason to buy Some strategists are advising to sell the bounce Negative supply shocks are bad for the economy Weakness in U.S. bonds, stocks, and the dollar has investors scared Data is beginning to point to an economic slowdown The Chicago Fed National Activity Index (CFNAI) is one of the most important and overlooked economic indicators The Stock Market The S&P 500 rose 4.6% last week and finished at 5,525.21. The Dow rose 2.5% and the Nasdaq gained 6.7%. The S&P’s gains were attributed to President Trump’s statements at a Tuesday press conference. He said that Chinese tariffs would come down, and he wouldn’t fire Fed Chairman Jerome Powell. The 10-year Treasury yield ended the week at 4.25%. The two-year Treasury yield finished at 3.79%. The dollar rebounded. The dollar index (DXY) ended the week at 99.587. It hit a 3-year low of 97.921 on Monday. The DXY has lost 9.6% since mid-January. Tariffs and the dollar's safe-haven status should have pushed the dollar higher, not lower. It is believed that foreigners are repatriating their money. America needs foreign capital. Interest rates will have to go higher to entice foreign capital to our shores if safe-haven status is lost.
By Christopher Norwood April 21, 2025
Executive Summary The S&P 500 fell 1.5% last week to finish at 5,282.70 Counter-trend bounce started on April 7th Counter-trend rallies are short and sharp Thursday was an inside day Any trade war announcements will lead to more volatility Uncertainty is high, and consumer confidence is low The Federal Reserve is focusing on inflation The Philly Fed and Empire State indices continue to rise Small business owners are raising prices to offset input costs The Stock Market is still in a downtrend The Stock Market
By Christopher Norwood April 14, 2025
Executive Summary The S&P 500 had its best weekly gain since 2023 due to the suspension of most tariffs The Trade War and tariffs have dominated stock market action Daily announcements on the tariff front have led to high volatility The market is still in a downtrend Tariffs will negatively affect the U.S. economy Rising prices will reduce consumer demand U.S. earnings estimates are coming down; currently $267 and falling Pay attention to what bond investors are thinking The weakening dollar fell to its lowest level since 2022 The U.S. needs foreign capital
By Christopher Norwood April 7, 2025
Executive Summary The S&P 500 fell 9.1% and ended the week at 5,074.08 Bond yields are declining as investors flee stocks CME FedWatch tool now forecasts 3 to 4 Fed funds cuts in 2025 Inflation is higher than the Fed’s target and trending in the wrong direction The Volatility Index (VIX) spiked on Friday. Investors are showing fear The Stock Market is due a bear market bounce The longer-term downtrend likely won't end until Trump’s Trade War ends Market strategists are raising the odds of a recession and reducing price targets The Fed has a dilemma. It doesn't have the tools to deal with rising inflation and slowing economic growth simultaneously
By Christopher Norwood March 31, 2025
Executive Summary The S&P 500 fell 1.5% and ended the week at 5,580.94 The energy & healthcare sectors are the leading gainers year to date The S&P early highs and late lows are a sign of market weakness The fixed income market is signaling higher for longer Mortgage rates seem high to younger home buyers Mortgage rates were higher from 1972-2002 Earnings & GDP growth estimates are coming down The stock market reflects the economy Consumer confidence plunged to a 12-year low The economy is vulnerable to a declining stock market
By Christopher Norwood March 24, 2025
Executive Summary The S&P 500 rose 0.5% last week to finish at 5,667.56 breaking its four-week losing streak The uncertainty surrounding the trade war will weigh on the economy and capital markets for the foreseeable future. Economists and the public aren’t sure whether to worry about inflation, weakening economic growth, or both. The Summary of Economic Projections (SEP) signals two rate cuts and a higher year-end inflation number Invoking the Alien Enemies Act of 1798 will lead to higher prices U.S. stocks are the only asset class losing money in 2025 The Stock Market The S&P 500 rose 0.5% last week to 5,667.56. The Nasdaq rose 0.2% and the Dow was up 1.2%. The S&P broke a four-week losing streak. It was due for an oversold bounce. We wrote last week, “The S&P is primed to bounce this week, likely at least back to the 200-day moving average residing at 5,740.” The S&P did bounce but only reached 5,715.33 on Wednesday around 3 p.m. Fed Chairman Powell was speaking soothing words at the time to investors during his press conference following the Federal Reserve FOMC meeting. The S&P couldn’t build on Wednesday’s late gains though, although it did try.
By Christopher Norwood March 17, 2025
Executive Summary • The S&P 500 fell 2.3% last week to finish at 5,638.94 • The S&P is down 4.13% year-to-date • The Nasdaq fell into correction territory and is down 11.6% since mid-February • Market strategists are saying recession risk is rising • Tariffs hurt the economy • Consumers and small business owners are feeling the pinch • The NFIB Uncertainty Index rose to its second-highest level ever in February • The Trump administration is targeting a lower 10-year Treasury Yield • Interesting Charts below The Stock Market
By Christopher Norwood March 10, 2025
Executive Summary The S&P 500 fell 3.1% last week to finish at 5,770.20 The S&P closed 50 points above the 200-day moving average on Friday A bearish crossover or a “dark cross” indicates a loss of momentum A correction of 10% or more is increasingly likely Founder of AQR, Cliff Asness makes some important observations Interesting Charts below The Stock Market The S&P 500 fell 3.1% last week to finish at 5,770.20, its worst week since September. The S&P is down 1.9% for the year. Technology (XLK) is down 6.01% year-to-date. Consumer discretionary (XLY) is down 8.33%. The other nine S&P sectors are up on the year, led by Health Care (XLV), which is up 8.51%. Consumer Staples (XLP) is the next best-performing sector, up 5.41%. The 10-year Treasury Yield rose to 4.31% from 4.21% last week. The two-year yield was unchanged at 4.01%.
By Christopher Norwood March 4, 2025
Executive Summary The S&P finished the week at 5,954.50 High government spending has kept the economy growing The S&P has been trading sideways for four months now The Magnificent 7 and technology are out. Healthcare, Financials, Real Estate, and Consumer Staples are in Uncertainty is high Interesting Charts below  The Stock Market The S&P 500 lost 1.0% last week, closing at 5,954.50. The Nasdaq fell 3.4% during the week. Treasury yields continued to fall. The 10-year Treasury closed the week at 4.21%. The two-year Treasury yield dropped to 4.01%. The 3-month yield ended the week at 4.34%. The yield curve inverted once more. The 3M/10Yr curve inversion increases the chance of a recession in the next 12-18 months. Of course, the curve was already inverted until last December when it began to normalize. The 3M/10Yr curve last inverted in late October 2022. The period from October 2022 until December 2024 marked the longest continuous stretch of inversion since 1962. And yet no recession materialized, at least it hasn't yet. The lack of a recession in 2023/24 was most likely because of massive fiscal spending. The federal government has run large deficits since the pandemic. Government spending was $6.9 trillion in 2024, almost 25% of GDP. The government's deficit spending has kept the economy growing.
By Christopher Norwood February 24, 2025
Executive Summary The S&P finished the week at 6,013.13 Volatility is still low despite last week's rise to 18.21 The tech sector is trailing the S&P More stocks are participating in the U.S. stock market gains International & Emerging markets are outperforming the U.S. markets Interesting Charts below  The Stock Market
More Posts