

Executive Summary
- The S&P and Dow had their best weeks of the year
- Possibility of new tax cuts in 2025
- Norwood Economics believes continued rate cuts are a mistake
- Trump’s supply-side economics revival will lead to even bigger deficits
- Tariffs are inflationary
- Tariffs harm American consumers
Market/Economic Update
We wrote last week, “It is likely the S&P will end down this week for the third week in a row based on last week’s trading. The election looms large, however. Technicals suggest the market is positioning itself for a negative outcome. The problem is that no one seems sure what outcome would constitute a negative outcome. It might be a volatile week.”
It was a volatile week, mostly to the upside. Turns out the S&P and Dow had their best weeks of the year. The S&P finished at 5,995.54, up 4.7%. The election results spurred investors to buy on Wednesday after a down day Monday and a small gain Tuesday.
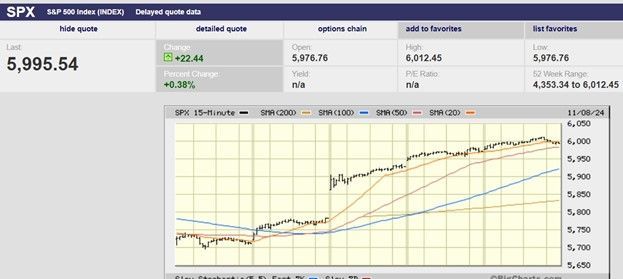
S&P 500 5-day
We continue to believe that the S&P will be higher by year-end. November and December are usually bullish months. The economy is growing above trend. The unemployment rate is low. Corporate profits are forecast to rise by 9.6% in Q4 and 13.3% in 2025. The Republicans will likely hold on to the House. A Republican House means Trump can extend his first term tax cuts. It also means Trump might be able to push through new tax cuts. He's said he wants to cut the corporate tax from 21% to 15% and stop taxing social security, tips, and overtime. The stock market should love it, at least for a while.
So, what could go wrong?
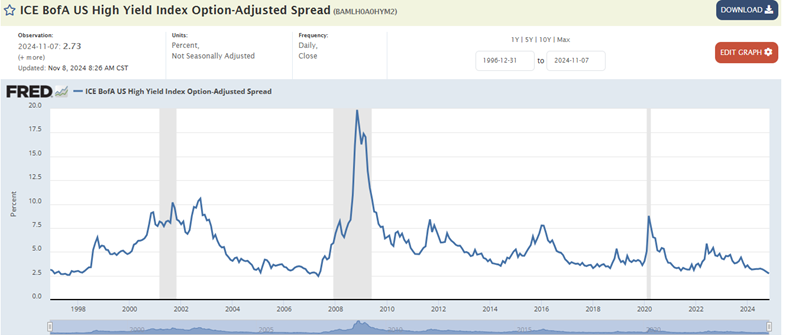
The most likely fly in the ointment is interest rates. The 10-year and 2-year continue to rise. It’s been a one-way trade since the Fed’s September meeting. The 2-year Treasury yield rose to 4.26% last week. The 10-year Treasury yield rose to 4.30%. The 2-year Treasury most closely tracks the Fed funds rate. The Fed cut by 0.25% on Thursday, lowering the funds rate to 4.50% - 4.75%. The 2-year yield is only 24 basis points (bps) from the lower bound of the new funds rate. The bond market is telling us that the Fed is almost done cutting. Or at least telling us that the Fed “should” be almost done cutting. The high-yield bond market agrees. The ICE BofA US High Yield index is at 2.73%, near all-time lows. The tight spread between high-yield bonds and Treasuries means there is no stress in the credit markets. It means there is plenty of liquidity. It means the economy is doing fine and doesn’t need a lower Fed funds rate.
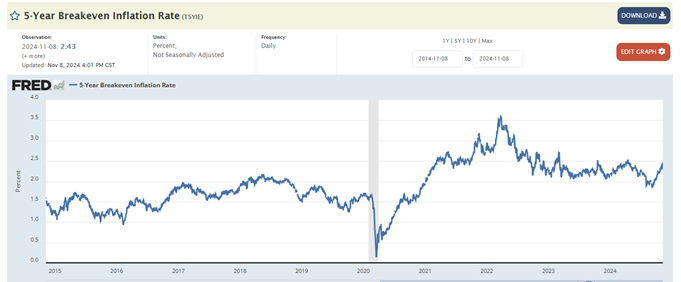
Rising 5-year breakeven inflation expectations also argue for the Fed to stop cutting. The 5-year breakeven has climbed from 1.86% to 2.43% since September 10th.
The futures market isn’t so sure that the Fed is done cutting though. The CME FedWatch tool places the odds of no cut in December at 35.1%. It has the odds of a 0.25% cut at 64.9%. There is much economic data to parse between now and the next Fed meeting on 18 December. The Consumer Price Index (CPI) will be released on Wednesday. The Producer Price Index (PPI) will be released the following day. The Personal Consumption Expenditure (PCE) index comes out on 27 November. The November jobs report comes out on 6 December. Powell’s data-dependent Fed will parse the data and then decide.
Powell characterized monetary policy as restrictive last week. The Fed believes that interest rates are at a level that will allow economic growth. Rates are also at a level that will lead to 2% inflation he claims. The inflation rate has fallen. Whether inflation will fall to 2% is still unknown. Economic growth? It doesn't appear to be slowing at all. The economy grew 2.54% in 2023. It grew 2.8% in Q3 2024 following growth of 3.0% in Q2. The Atlanta Fed GDPNow forecast for Q4 is 2.5%. The Consumer Conference Board’s current estimate of GDP growth for 2024 stands at 2.6%.
A longer-term look at GDP also shows current growth at a normal level and holding steady.
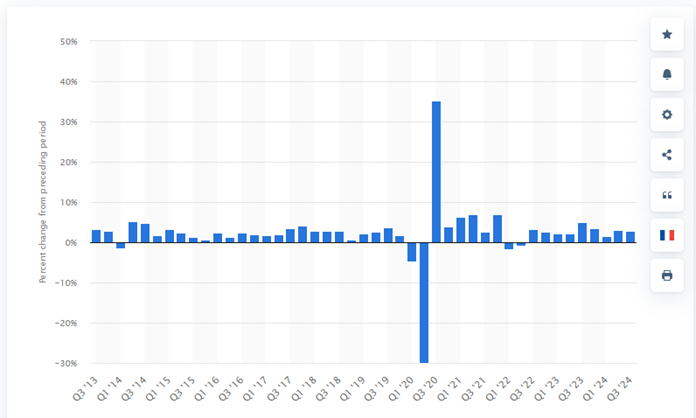
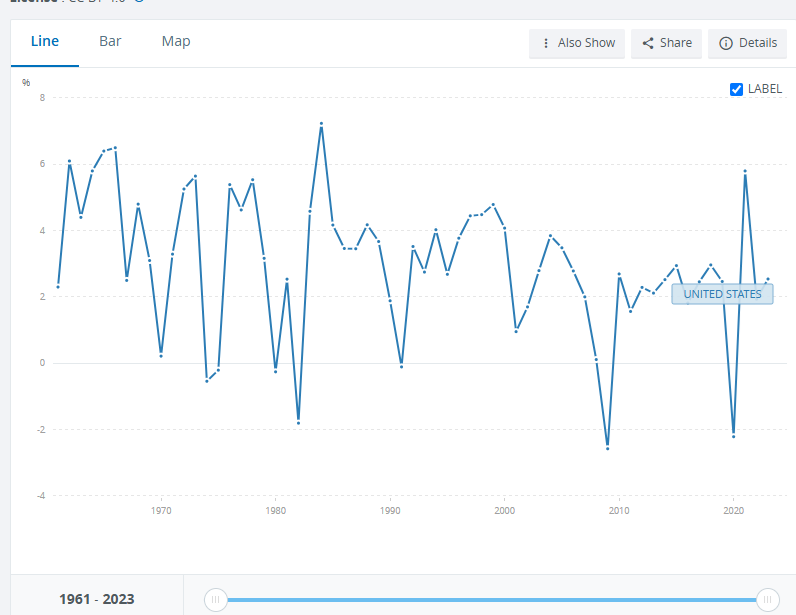
The long-term chart above shows annual GDP growth since 1961. The economy is doing fine.
The Fed's real reason for cutting rates is likely the neutral rate. Powell believes monetary policy is restrictive because the Fed believes the neutral rate is around 3%. We know that’s the case. One need only look at the most recent Dot Plot. It has the Fed funds rate at 2.9% by year-end 2026. The dot plot for 2026 also has the economy growing at 2% with the PCE inflation gauge at 2%. Ergo the neutral rate must be around 3% in the Fed's view. Except the economy isn't slowing. It grew well above 2% in 2023. It's growing closer to 3% in 2024. It seems the neutral rate is higher than what the Fed believes it to be.
Norwood Economics believes continued rate cuts are a mistake. Financial conditions are already loose. The Trump administration plans to push for more fiscal stimulus in the form of tax cuts. The odds of rising inflation in 2025 are increasing. To make matters worse, more tariffs will add to the inflationary pressures.
The federal government has a good reason to want rates to fall though. Interest on the debt has risen rapidly. The estimate for this year is $882 billion. The military budget is only $874 billion. Only Social Security at $1.6 trillion is larger. Lower rates would reduce interest payments. Lower rates would also lead to higher growth and thus even more inflation (all else equal). Higher inflation makes it easier to repay debt though.
Higher inflation and larger deficits make Trump’s focus on supply-side economics problematic. Supply-side economics is associated with Ronald Reagan. Reaganomics was partly supply-side economics. Nobel Laureate Milton Friedman stated, "Reaganomics had four simple principles: Lower marginal tax rates, less regulation, restrained government spending, (and) noninflationary monetary policy.” Lower taxes and less regulation are central tenets of supply-side economics. They also appear to be central tenets of Trump’s economic policies. Unfortunately, “Trumpanomics” doesn’t appear to include restrained government spending. To be fair Bidenomics isn’t about restrained government spending either. Nixon reportedly once said that “We are all Keynesians now”. We will add that “There are no fiscally responsible political parties now.”
As for the last of the four simple principles, noninflationary monetary policy appears out of reach as well. The Fed has failed to conduct sound monetary policy since 1987. That was the year Alan Greenspan introduced the world to the Fed Put. Asset inflation has been with us ever since.
Existing huge deficits are a problem for Trump’s supply-side economics revival. Cutting taxes when huge deficits are already the norm will lead to even bigger deficits. The U.S. deficit is already approaching 7% of GDP. Large tax cuts will increase demand, but only for a few years. Aggregate supply is unlikely to keep up, at least in the short term. A lack of labor is one inhibiting factor. Inflation is the result when demand increases without a sufficient increase in supply. Imposing tariffs and restricting the labor supply will also push prices up.
Stocks are better at hedging against inflation than bonds. But only after the price-to-earnings ratio contracts. P/E multiples have a long way to fall given their elevated starting point. The S&P is trading for 22x next year’s earnings. The long-term average is 16.5x. Of course, it is a market of stocks, not a stock market. There are parts of the market that are cheaper than others. The iShares S&P 500 Value ETF is trading at 17 times 2025 earnings, according to Barron’s. The iShares S&P 500 Growth ETF is trading at 28 times 2025 earnings, above its five-year average of 23. The U.S. economy is around 25% of the world economy. The U.S. stock market is over 50% of the world stock market. Investors aren't restricted only to the high-priced U.S. stock market.
U.S., foreign, and emerging markets were all cheap in 2009. The CAPE ratio was around 12 for all of them. The U.S. CAPE ratio has risen to 38. The other markets are still around 12. Emerging markets are 85% of the global population. They are 60% of global GDP. Emerging markets are only 10% of the world market cap. The average allocation in U.S. portfolios to emerging markets is around 2%, according to Barron's.
As for the U.S. stock market, here’s an excerpt from a Barron’s article:
“Irrational exuberance? We’re not there yet, but we’re fast approaching it,” says Joe DaGrosa, chairman and CEO of Axxes Capital. “P/E ratios are near historically high levels. How much further can multiples expand?” Good question.
Expect the stock market to continue higher into next year. Don’t expect another year of big gains. The more likely scenario is a sideways to down market. Earnings growth in the double digits next year could keep the bull market alive. Earnings growth estimates are more likely to fall than rise though. Single-digit earnings growth in 2025 and 2026 is more likely than the current estimates of 13.3% and 13.2% respectively. The stock market has an asymmetric risk profile going into 2025. Small upside with a bigger downside. Right now, investors are pricing the market as if nothing can go wrong. Something always goes wrong…it's just a matter of time.
Tariffs Impact on Inflation and GDP: (For the Geeks out there)
Tariffs are on the table, lots and lots of tariffs if Trump is to be believed. He may be overstating what he plans to do as a negotiating strategy. Time will tell. What is known is that tariffs are inflationary. Tariffs impose a price hike on imports after all. Domestic producers raise prices as import prices rise. The problem with price hikes is that demand falls as prices rise. Reduced demand reduces GDP growth. It’s the worst of both worlds, volume (real GDP) declines while prices rise. It’s too early to tell what fiscal policy will come out of the Trump administration. But the most likely scenarios lead to higher inflation. Tax cuts spur demand causing prices to rise as supply struggles to catch up. Tariffs are price hikes.

The chart above shows the impact of tariffs. Prices climb from P* to P-limit. Quantity falls from Q* to Q limit. The consumer surplus is P*EP with no tariff. The consumer surplus is P-limitAP with a tariff. P-limitAP is a smaller area under the curve than P*EP which means consumers have a smaller surplus (less benefit). Math is math and it does not lie. Tariffs raise prices and harm American consumers. American producers benefit. Importantly, society as a whole loses because the loss to consumers is greater than the gain for producers. The “deadweight loss” to society is the triangle ABE.
Regards,
Christopher R Norwood, CFA
Chief Market Strategist


