

Executive Summary
- The Nasdaq declined 1.6% after a 6-week rally
- The bond market couldn't make up its mind about the jobs report
- Investors appear nervous about the election
- Norwood Economics expects the S&P 500 to finish higher by year-end
- The six most expensive S&P 500 companies now account for 28.8% of the index market cap
- Save to spend later. Save to have a retirement
- Older Americans keep rolling the dice in the stock market
- Saving for long-term care is an important spending goal for retirement
Market/Economic Update
The S&P fell 1.4% to finish the week at 5728.8. The Nasdaq did join the S&P to the downside after rising seven weeks in a row. (We forecast that decline in last week’s newsletter). The Nasdaq fell 1.6%.
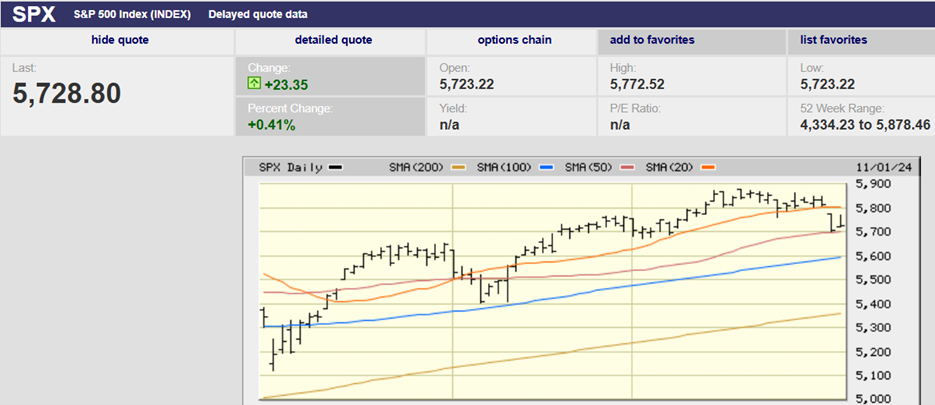
S&P 500 3-month chart
The S&P held support at the 20-day moving average for six days. It finally gapped down below the 20-day at the open on Thursday. The index traded down to the 50-day moving average where it closed just off its low for the day. The low Thursday was 5703.28. The S&P closed at 5705.45. The index fell 1.9% Thursday. Strategists blamed earnings reports from Microsoft and Meta Platforms for the down day. The setup for Friday was negative. A down day that took the index below the 50-day moving average seemed likely by Thursday evening.
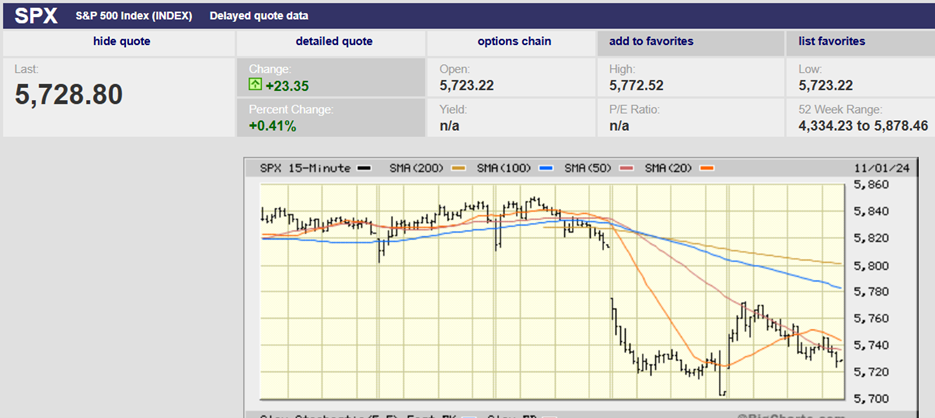
S&P 500 5-day chart
A weaker than expected jobs report led to a gap up open on Friday. At least that’s what the financial media reported. There wasn’t any follow through though. Selling pressure built early. The market peaked at 5772.52 at 10:30. The S&P bottomed Friday at 5723.22 before closing at 5728.80, not far from the low for the day. Bonds were indecisive about the jobs report as well. Bond yields fell in the immediate aftermath of the jobs report. The 2-year Treasury yield was down as much as 10 basis points (bps). The 10-year yield fell by 5 bps. By midday though the 2-year yield was up 1 bp and the 10-year was up 6 bps to 4.33%. The 10-year yield ended the week at 4.38%. The 2-year yield ended the week at 4.32%. The 10-year Treasury yield has risen over 60 bps since the Fed cut the funds rate by 50 bps in September.
Rising interest rates are a danger to a continued stock market rally. It’s likely long-term yields will begin to fall as the Fed continues to cut. It isn’t guaranteed though. Huge government deficits mean a higher term premium. Investors want to get paid more for the increased risk. Heavy deficit spending is also inflationary, as are tariffs. Falling 10-year yields are less certain than is normally the case during a Fed rate cutting cycle.
The trading action both Thursday and Friday was negative. It is likely the S&P will end down this week for the third week in a row. The election looms large though. Technicals suggest the market is positioning itself for a negative outcome. The problem is no one seems sure what outcome would constitute a negative outcome. It might be a volatile week.
Norwood Economics expects the S&P 500 to finish higher by year-end. That said, we may see a further pullback in the coming weeks before the market advances once again. The pullback from its most recent high has only been 2.5%. The election is a wild card. The results could send the stock market to new highs. A split Congress for instance is likely to be viewed favorably by investors. A red or blue sweep could lead to more selling.
Markets hate uncertainty. A multi-day delay in election results might be the catalyst for a deeper pullback. The 50-day moving average is immediate support. The 100-day is at 5,600. The 200-day is at 5390. There is support at 5,600 and 5,400 as well. The S&P 500 is likely to finish higher by year end regardless of the election results.
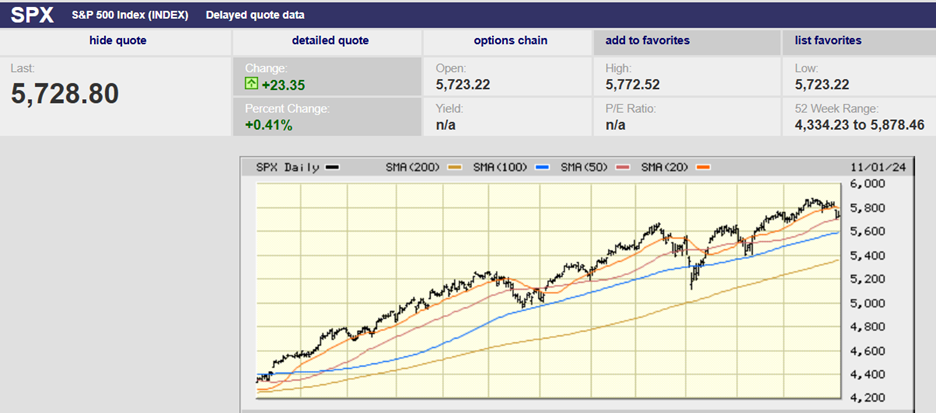
S&P 500 1-year chart
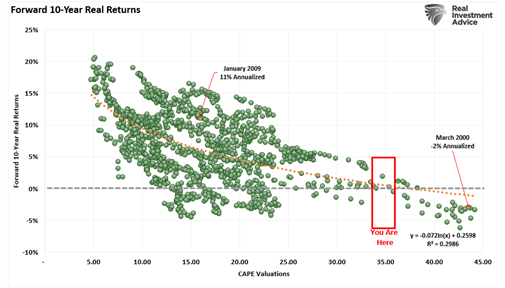
Returns will be muted over the next 10 years or so. The parabolic move in the S&P 500 isn’t sustainable. Markets can’t increase at an increasing rate forever. It is a mathematical impossibility.
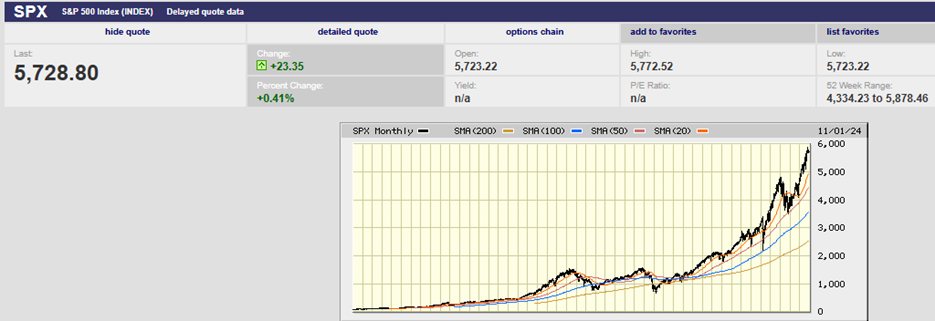
S&P 500 last 40+ years chart
Valuations are approaching extremes.
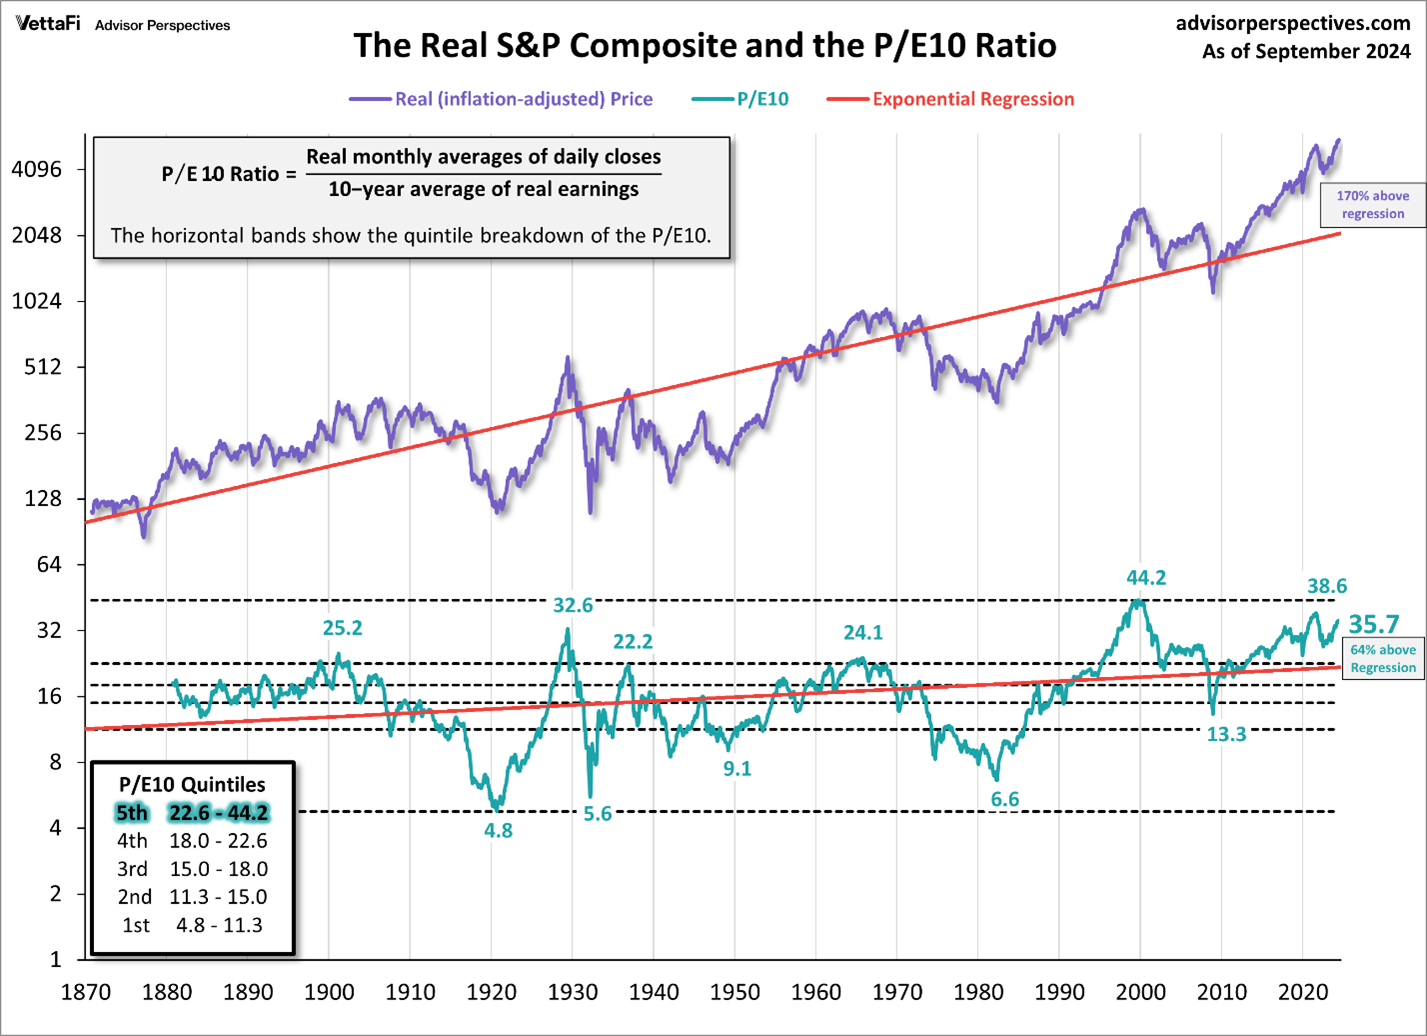
CAPE or the PE10 is near all time highs (chart above). At 35.7 it is in the 5th quintile. The S&P is trading well above its long-term trend line as a result.
Individual valuations have gotten stupid as well.
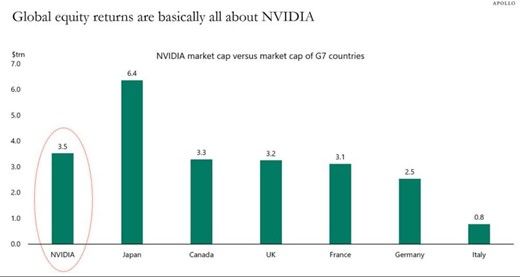
Nvidia’s market capitalization now exceeds the combined economies of Germany and Italy. Norwood Economics would rather own the German and Italian economies.
Longer-term returns will be less than average because of the current high valuation.
Concentration in the S&P 500 is extreme as well. The six most expensive S&P 500 companies are all in the tech sector. They now account for 28.8% of the index market cap which is a record.
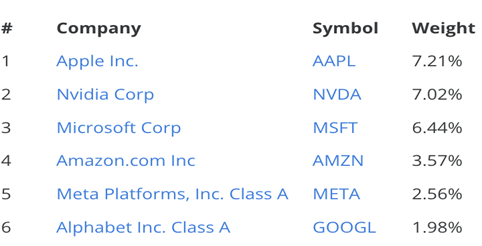
The S&P 500 is not appropriate as a standalone investment. It’s too concentrated. An investment in the S&P should only be part of a diversified portfolio.
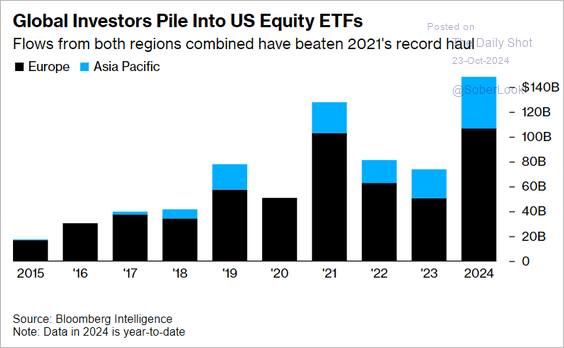
Investors all around the world are piling into the S&P 500.
The equity risk premium has shrunk. It hasn’t been this low since the early 2000s. The risk premium is the extra return needed to own equities instead of Treasury bonds.
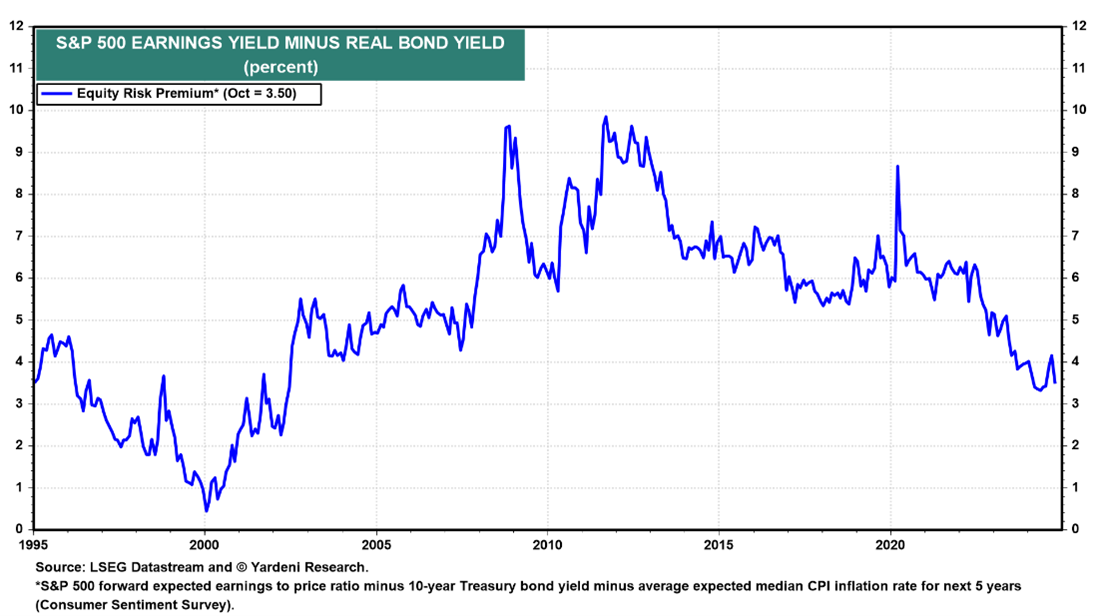
Today’s equity risk premium is at the 15th percentile of a 100-year distribution, according to Danielle Park, CFA. It means stocks have rarely been more expensive relative to bonds.
Yet investors are loading up on stocks, including older people. An excerpt from the Wall Street Journal titled "America’s Retirees are Investing more like 30-year-olds":
Older Americans keep rolling the dice in the stock market, ignoring the conventional wisdom to protect their nest eggs by shifting more of their investments to bonds.
Nearly half of Vanguard 401(k) investors actively managing their money and over age 55 held more than 70% of their portfolios in stocks. In 2011, 38% did so. At Fidelity Investments, nearly four in 10 investors ages 65 to 69 hold about two-thirds or more of their portfolios in stocks.
And it isn’t just baby boomers. In taxable brokerage accounts at Vanguard, one-fifth of investors 85 or older have nearly all their money in stocks, up from 16% in 2012. The same is true of almost a quarter of those ages 75 to 84.
Norwood Economics builds diversified portfolios. The portfolios hold bonds, domestic and international stocks, real estate, and precious metals. Financial planning tells us the return needed for a client to meet their spending goals in retirement. We build diversified portfolios to limit risk as much as possible while targeting the needed return. Remember, we save so we can spend later. We save so we can have a retirement.
Long-Term Care Insurance
The Centers for Disease Control and Prevention notes that falls are the leading cause of injury in Americans 65 and over. The need for long-term care often begins with an injury from a fall. Yet Medicare doesn’t include a no-cost comprehensive fall risk assessment. Nor does Medicare cover long-term care except following a qualifying hospital stay.
According to Medicare.gov, a qualifying hospital stay describes an inpatient admission that lasts at least three consecutive days. The discharge day doesn't count. If a patient meets this requirement, original Medicare will pay for nursing home costs as long as:
The patient is enrolled in Medicare Part A. A doctor orders the skilled nursing care. It occurs in a Medicare certified facility. The patient begins receiving care within 30 days of their discharge.
Even then Medicare only pays for up to 100 days of care in a skilled nursing facility. Patients become partially responsible for the cost after 20 days. Patients without supplemental coverage pay around $200 per day in coinsurance for day 21 to 100.
Meanwhile long-term care insurance is expensive. A Barron’s cover story a few weeks ago detailed the many problems with long-term care insurance. One couple Barron's interviewed has already paid $94,600 in premiums during the last 16 years. Now Genworth is asking for a rate increase of 143%. The couple’s long-term care premiums will rise to $25,800 annually if the increase is granted. Lori Penman, who is 71, told Barron’s they won’t be able to afford the new premiums if granted. There are no refunds of premium when a policy is canceled.
Long-term care is a problem for many Americans. Relatives often bear the brunt of caregiving. Female relatives are most often the caregivers. And that’s while they are also working and raising a family of their own.
Norwood Economics financial plans for self-insurance for its clients. We recommend clients save $200,000 to $300,000 per person by retirement age for long-term care. That money stays invested until it's needed for long-term care. Most long-term care dollars are spent in a person’s 80’s and 90’s.
There are some partial long-term care insurance solutions that are less costly. They are also less comprehensive. Saving for long-term care is a spending goal for retirement. Everyone should plan for it. No one should want to become a burden to their loved ones in the waning years of their life.
Regards,
Christopher R Norwood, CFA
Chief Market Strategist


