

- The FedWatch Tool September cut odds over 90%
- Multiple Cuts Back on the Table
- Crowded Trades Blow Up

New Paragraph
Market Update
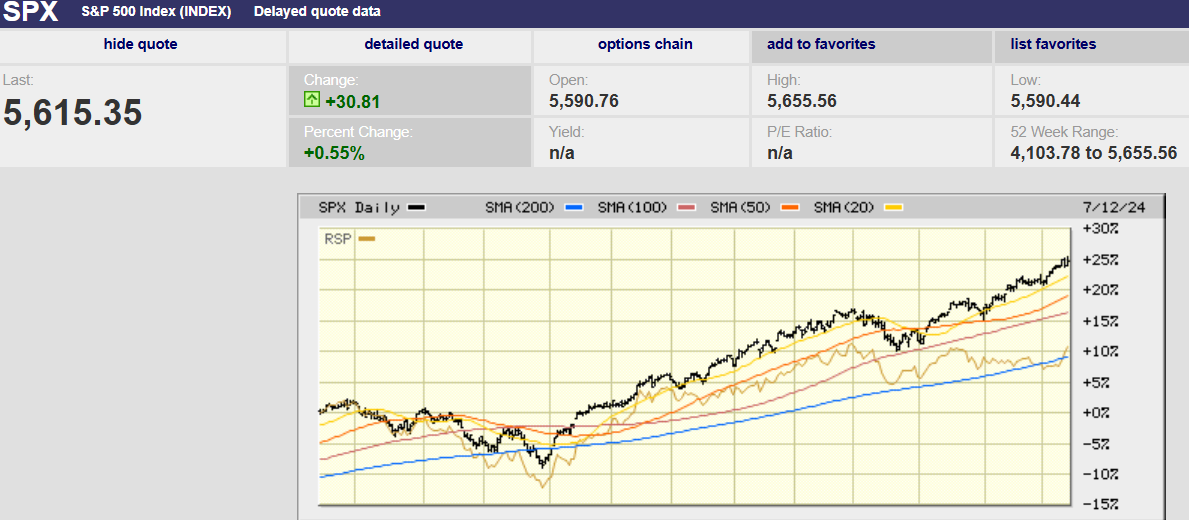
The S&P 500 rose 0.9% last week to finish at 5,615.35. The index set early highs Monday and Tuesday. Public money trades early in the day and smart money late, according to Wall Street lore. That same conventional wisdom has public money trading early in the week and Wall Street money late. Tuesday the market was flat, despite Powell suggesting that the first-rate cut was coming in September. Pundits would have pointed at that comment as the reason for a rally if the market had rallied.
Wednesday saw a run-up as Powell continued his testimony on Capitol Hill. All the week’s gains and then some came on Wednesday as the index rose 1.0% on the day. There were no economic reports Wednesday. But Powell did testify that the Fed didn't need inflation to fall to 2% before starting to cut. Powell's comment gets the nod as the reason for the rise in the market Wednesday. Of course, proximity doesn’t mean causation, but the financial media knows humans want to know why.
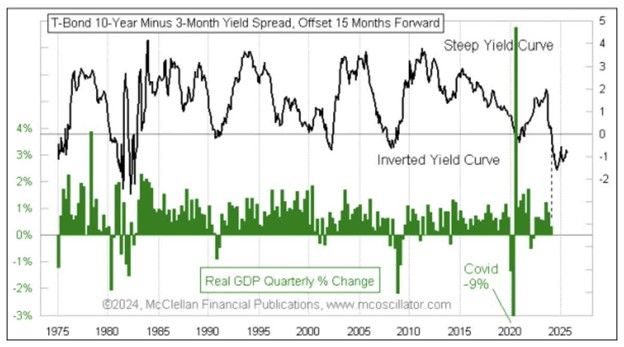
What he didn’t say is that cuts won’t impact the economy for over a year. Monetary policy works with long and variable lags. Cuts made this year won't impact the economy until sometime in 2025. As an example, below is a chart showing that the 10-year/3-month yield curve inversion doesn’t lead to recession until 15 months later, on average.
Thursday saw another early high on the back of a better-than-expected CPI report. The index started selling off less than an hour into the trading day. It gave back all Wednesday’s gains by the end of the day. Perhaps it was a case of buy the rumor sell the news. Friday saw an early rally despite a marginal Producer Price Index (PPI) report. The rally fell apart in the last hour of trading, giving up about half of the gains from earlier in the day. Late selling on Friday is considered a negative. It's thought to be an indication of nervousness among professional money managers. An unwillingness to hold positions over the weekend speaks of uncertainty.
Setting the day-to-day back and forth of the algorithms aside, the S&P is still advancing steadily. The 20-day moving average is around 5,500, some 2% below Friday’s close. The 50-day is around 5,375, some 4.3% lower. The sideways trading in the second half of June was a sign of strength. Strong markets consolidate in time rather than price.
The index is overbought and overvalued, but still trending higher. Something will eventually trigger a pullback. The earnings season is upon us. Disappointing guidance might be the catalyst. Short-term market movements have very little to do with fundamentals though. Sentiment and technicals rule in the short-term. For now, it appears to be up, up and away.
Economic Indicators
The big news out last week was a better-than-expected CPI report. The CPI fell 0.1% in June. The headline number fell for the first time since May 2020. It rose 3.0% year-over-year, down from 3.3% the prior month. It was a better number than the forecast 3.1%. Core CPI was up 3.3% year-over-year, down from 3.4% the prior month. Core CPI rose 0.1%, an improvement from the 0.2% rise the prior month and better than the expected 0.2%. The S&P 500 sold off Thursday despite the better-than-expected CPI report.
The PPI report came out on Friday. It rose 0.2% in June, up from 0.0% the prior month. The report was worse than the expected 0.1%. Core PPI was flat in June, better than the expected 0.2%. The PPI report is watched because some of its inputs are also inputs for the Personal Consumption Expenditure (PCE) index. And the Fed reportedly uses the PCE to conduct monetary policy.
The NFIB Small Business Optimism Index reached the highest reading of the year in June at 91.5. It was a one-point increase from last month, but still a weak number. The last time the index was higher was in December of 2023 when it reached 91.9. It is the 30th month below the historical average of 98. Inflation is still the top small business issue. More than one in five owners report it as their single most important problem in operating their business. “Main Street remains pessimistic about the economy for the balance of the year,” said NFIB Chief Economist Bill Dunkelberg.
Initial jobless claims were 222,000 last week, down from 239,000 the prior week and below expectations of 236,000. It was another strong report.
The CPI report has investors raising the odds of a Fed rate cut in September. The CME FedWatch tool now has the odds at 90.3% for a rate cut in September. The odds of two rate cuts this year have increased as well. The futures market is placing the odds of two or more cuts at 94.3%. The two-year Treasury yield has responded by dropping to 4.5%. It is the rate most sensitive to Fed monetary policy. The two-year Treasury was at 5.05% on April 30th. It was 4.98% on May 29th. It was 4.72% on June 28th. The bond market is confirming that cuts are coming soon.
Earnings season is here, and investors will be watching nervously. The fear is that a slowing economy and slowing inflation will impact earnings more than expected. Disappointing guidance could lead to a 10% or greater pullback in the market. The earnings bar is set high. The odds still favor a pullback of 10% or more sometime before year end.
Everyone is in the Pool
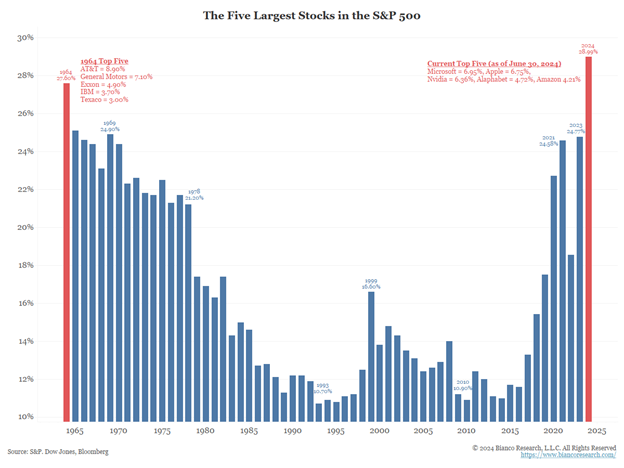
It’s well known on Wall Street that crowded trades blow up. That's because there’s no one left to buy once everyone who wants to buy has bought. The Magnificent Seven trade is crowded. Money managers are doubling down rather than looking for less crowded trades. “Active fund managers appear to have decided that the solution for a concentrated market is concentration,” according to the BofA. Strategist Savita Subramanian noted in a recent note that, “the average large-cap fund has a third of its portfolio in just five stocks, up from 26% in December 2022. She also noted that a quarter of all large-cap funds have more than 40% of their portfolio in five stocks, up from 5%. “Funds’ concentration risks have grown alongside the benchmarks’,” she writes. The five biggest S&P 500 companies now make up a record 29% of the U.S. market capitalization. It’s the result of everyone piling into the same trade.
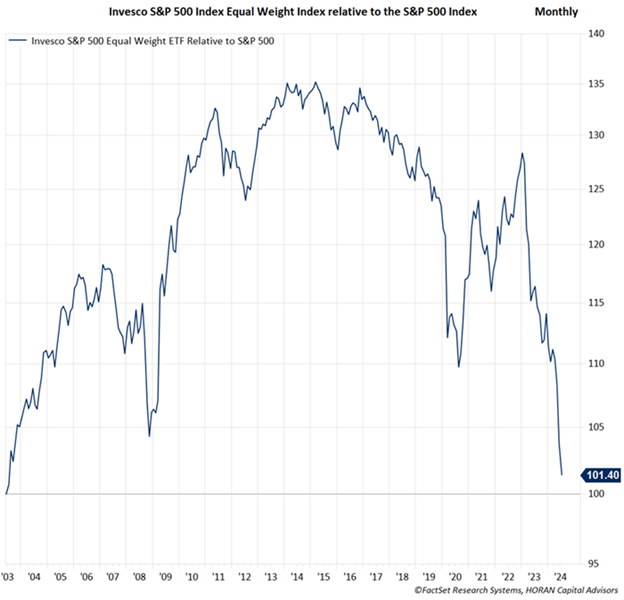
The equal weighted S&P has outperformed the S&P since it was created in 2003. The rush by money managers to concentrate their investments in the biggest stocks has almost erased that outperformance.
But it isn’t only mutual fund managers that are concentrating their investments. Individuals are concentrating their investment assets in equities like never before. Households are holding the highest percentage of their financial assets in equites in at least 70 years, according to Danielle Park, CFA.

It is a higher percentage even than 1966 and 2000, dates that marked the beginning of bear markets. The 1966/68 top preceded a secular bear market.
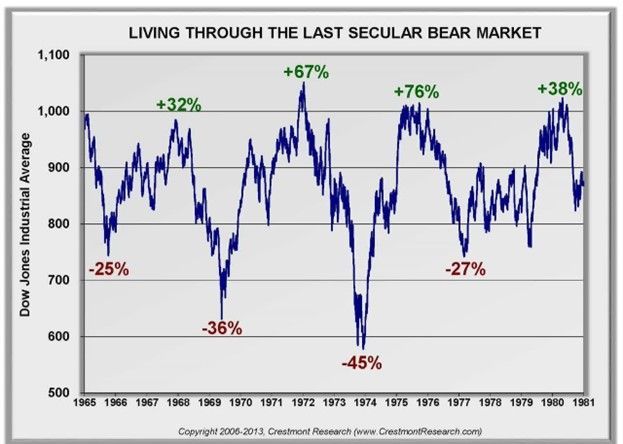
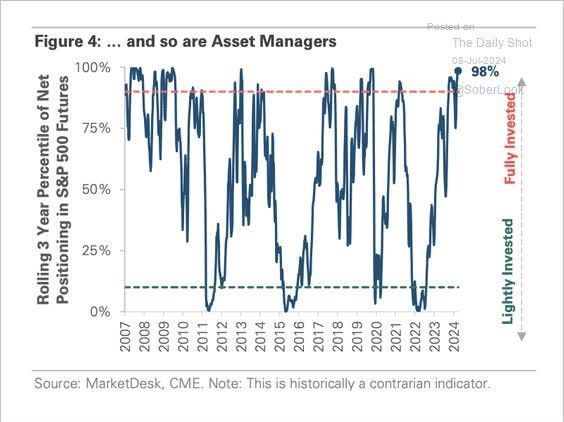
Stocks tumbled 25% to 45% four times and took 16 years to grow back losses. Prices compressed from 21 times earnings in 1966 to 8 times by 1982. Most professional asset managers are also at record equity allocations. They are trying to track the gains of stock indices. It is dismal risk management for their customers.
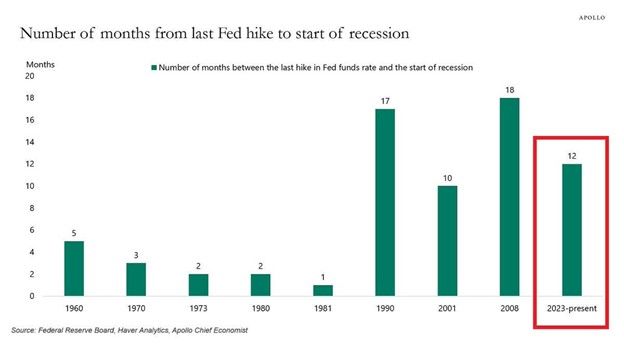
Money managers and retail investors are all in on stocks even as monetary policy indicates a high likelihood of recession. Recessions have followed the first Fed rate hike by a range of 4 to 14 months (average of 10) since 1958, according to Park. The Fed’s last rate hike was 12 months ago in July 2023.
One other reliable recession indicator is getting close to triggering. We’ve written about it a few times recently. The Sahm Recession Indicator was developed by Claudia Sahm while she was at the Federal Reserve. The indicator was 0.43 in June, according to the St. Louis Federal Reserve. The Sahm indicator might be triggered as early as the next unemployment report in July. According to Seeking Alpha Analyst James Picerno. The indicator is triggered when the 3-month average unemployment rate rises by 0.50 or more above the 12-month trailing low.
The higher-than-normal risk of recession urges caution. An expensive market also urges caution. The all-in investor mentality on both Wall Street and Main Street is typical of tops.
Caveat Emptor
Regards,
Christopher R Norwood, CFA
Chief Market Strategist


