

- There are Signs the Economy is Weakening
- The Risk of Recession Continues to Rise
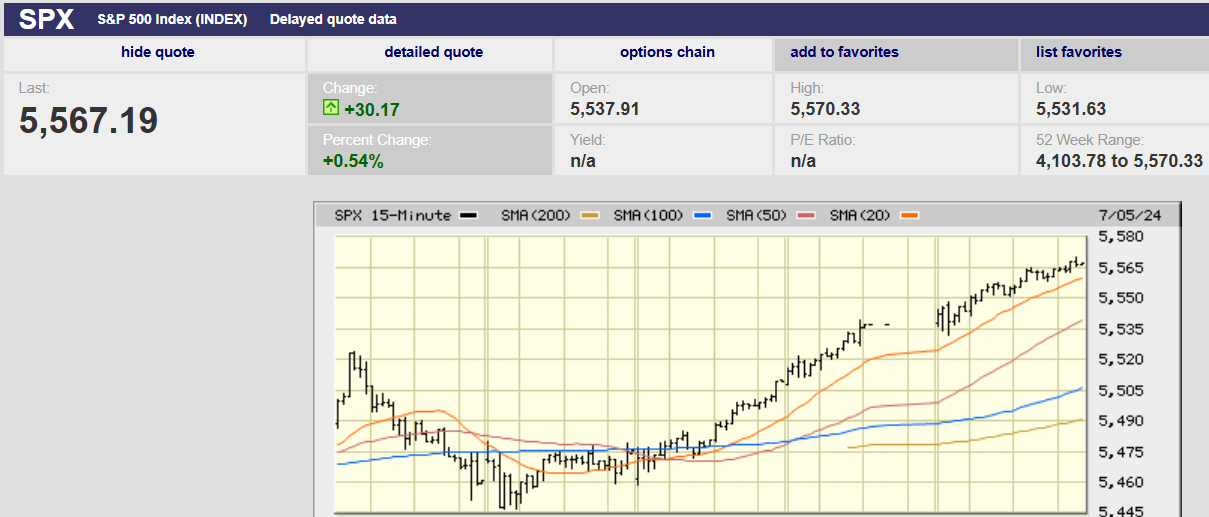
5-day S&P 500
Market Update
The S&P 500 rose 1.95% last week to close at 5,567.19. It was a holiday-shortened week with light volume. The index bottomed out at 5,445 in the first hour of trading on Monday before reversing higher. It never looked back as it began a climb to a record high of 5,570.33 by Friday. It hit its latest record high in the last 30 minutes of trading. Light volume moves often don’t last. Now though it looks as if the index has broken out after a period of consolidation and is ready to run higher.
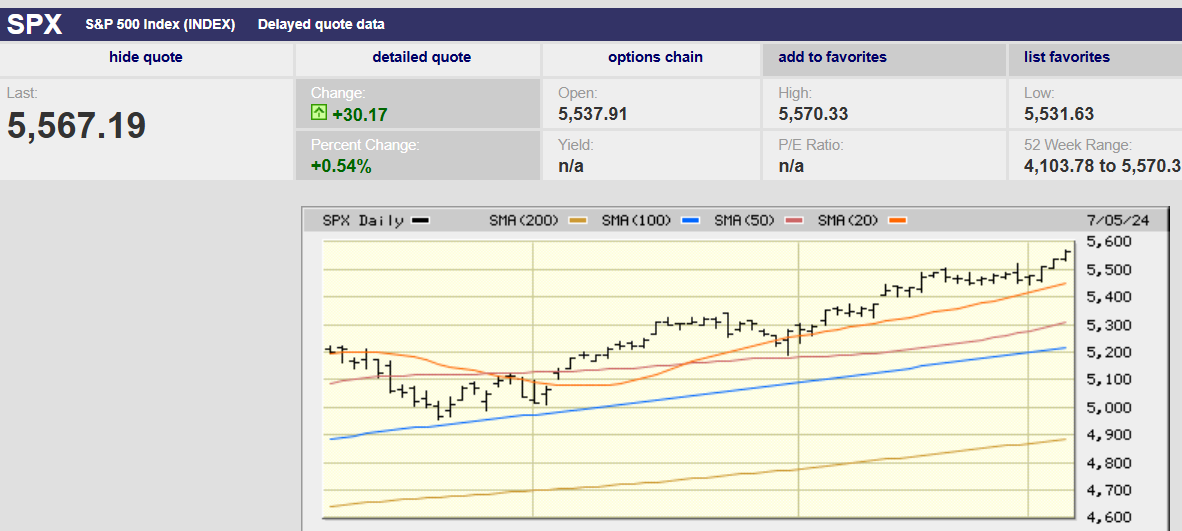
3-month S&P 500
The light volume last week combined with a short-term oversold condition tempers that expectation. There is a chance the small breakout will reverse in the coming week. We wrote last week and the week before that the S&P was due for a pullback. It still is. So far it hasn’t happened though. It might not happen for a few more weeks now that the upside has been confirmed by Friday's move higher. Momentum can take on a life of its own and investors seem determined to push the index higher.
Meanwhile, the economy is looking less robust. The Federal Reserve Bank of Atlanta’s GDPNow forecasting model puts second-quarter growth at 1.5%. The forecasting model is fairly accurate within 30 days of the report’s release. The second quarter GDP report release is scheduled for 25 July. A second sub-2% quarter of GDP growth might set off warning bells. Adding 1.5% real GDP growth to the expected 3.1% consumer price index (CPI) report, due on Thursday, gives us a nominal GDP growth rate of 4.6%. A sub 5% nominal GDP growth rate makes it less likely that earnings will hit their estimates. Currently, the Q2 earnings growth estimate is 8.5%. Earnings growth for 2024 is forecast to be 10.1%. Since 1947, earnings per share have grown at 7.72%, while the economy has expanded by 6.35% annually, according to Lance Roberts, managing partner of RIA Pro. Read that last sentence again. The historical data doesn’t line up with the current expectation. Earnings growth of 8.5% in Q2 and 10.1% for 2024 with nominal GDP growing of less than 5% is possible but unlikely. Earnings will disappoint over the next four quarters.
The Fed is going to cut in September. There is enough economic weakness surfacing to provide sufficient cover. The CME FedWatch tool is forecasting a 72% chance of a quarter-point cut in September. It is forecasting a 76.6% chance of at least two cuts by year-end. The Fed is going to make cuts before the year-end despite inflation that is still well above its 2% target. It will be betting that inflation will continue to slow towards its 2% target, far from a sure thing. Norwood Economics believes the chance of recession is rising. We think it likely that the economy slips into recession in the next 12 months.
Economic Indicators
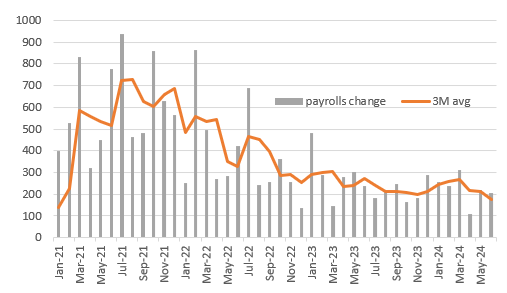
The payrolls report was the big news last week. Investors are watching employment closely. They believe the Fed will start cutting if the jobs market looks threatened since full employment is one of the two Fed mandates. The other is price stability. Investors expect the Fed to start cutting rates in September, in part due to expectations of a softening labor market.
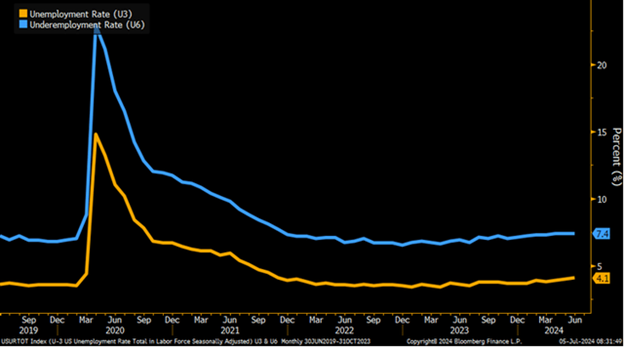
Nonfarm payrolls in June again topped economists’ estimates though. Payrolls increased by 206,000. The consensus guess was for an increase of 190,000. The two prior months’ totals were revised down by 111,000. The revisions helped take the sting out of the better-than-expected report. Also, the unemployment rate rose to 4.1% from 4.0%. All in all, it was a good jobs report not a great jobs report, at least that's how the pundits are spinning it. Ed Hyman of Evercore ISI points out workers’ incomes were up a “solid” 5.1% from a year earlier. That would put pay well ahead of inflation. The consensus forecast for CPI is for a 3.1% rise from a year earlier. Core CPI is forecast to rise 3.4% year-over-year.
Jobs growth exceeding 200,000 shows strength in the jobs market. Inflation above 3% and declining slowly means inflation isn’t whipped yet. However, there are some signs that the economy is weakening.
The unemployment rate is trending higher.
Average hourly earnings increases continue to decline.

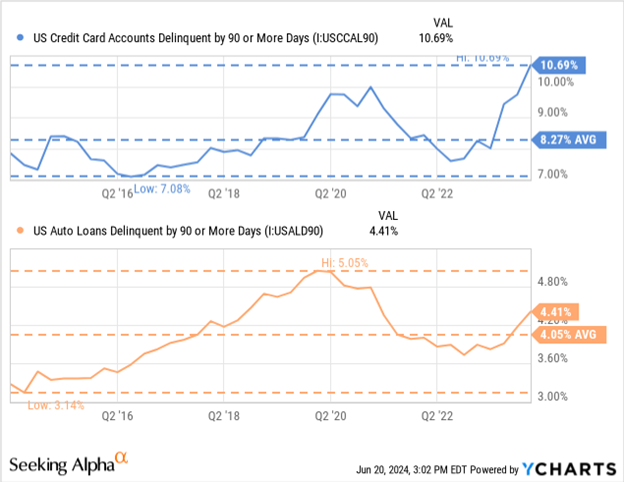
Credit card and auto loan delinquencies are rising.
Jobs growth is slowing.
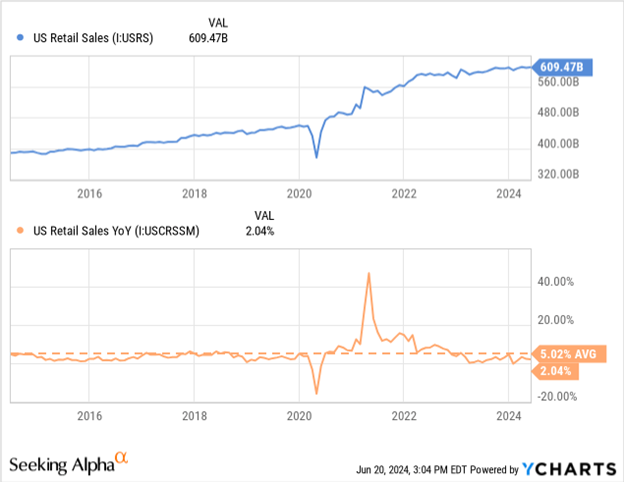
Retail sales growth is weak.
The next few quarters will determine whether we have a soft landing or slide into recession.
Investment Landscape
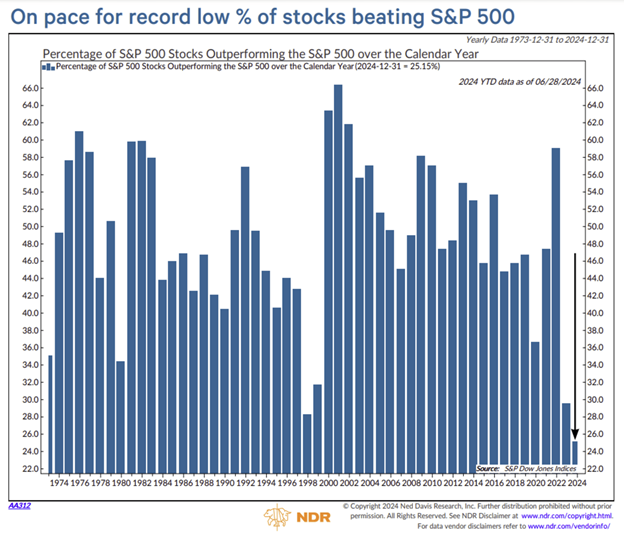
We’ve written a few times recently about the unusual nature of the bull market advance since the fall of 2022. Here are a few more data points for readers that highlight how unusual the advance has been.
Market breadth has been extraordinarily narrow.
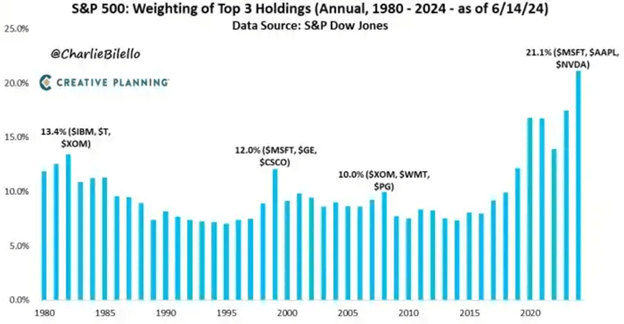
Three stocks now make up 21% of the S&P 500 market capitalization.
The top 10 U.S. champions also account for nearly 20% of a global portfolio, the highest share in over 50 years.
The seven mega-cap U.S. tech stocks known as the Magnificent Seven account for 67% of the S&P 500’s advance in 2024 through last Tuesday, according to Dow Jones Market Data. Those seven stocks have added $4.18 trillion in value, more than the value of the Japanese economy. Those seven mega-cap stocks have returned more than 50% since the start of 2023. Such rapid growth in market cap for mega-caps is rare.
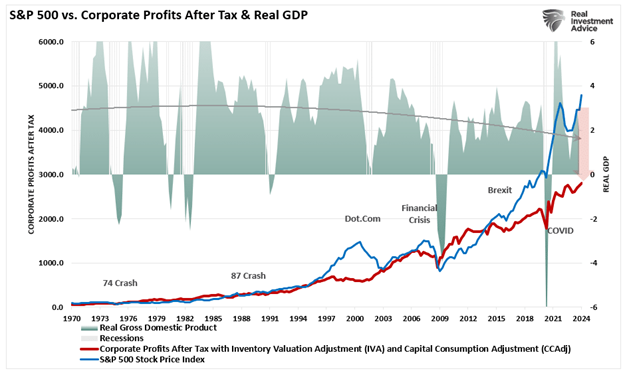
The huge advance in the Magnificent Seven, along with tech stocks more generally, has resulted in a very expensive and skewed market. The S&P 500 Information Technology Sector is trading at 33.5 times 12-month forward earnings after gaining 43% from its October 2023 low. The S&P has run well ahead of the economy and earnings growth as a result.
In the chart below you can see that the blue line (S&P 500) has run well ahead of the red line (corporate profits after taxes).
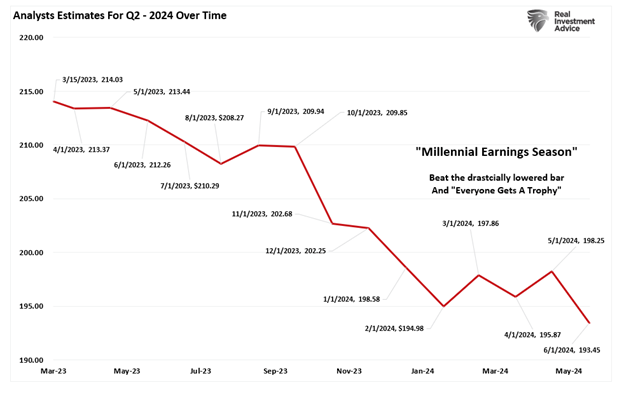
And earnings estimates are coming down, making the current situation even more dangerous for investors in an expensive market.
The danger is even greater for investors buying actively managed and index mutual funds. Index funds are forced to put a greater and greater percentage of investors’ money into the mega-caps as those mega-caps become a bigger percentage of the S&P 500. As a result, index investors are buying more of the mega-caps even as those stocks become increasingly expensive. It is the opposite of a buy low, sell high strategy.
Actively managed funds don’t want to be left behind. They are piling into the same mega-caps to stay up with the index. BofA Securities strategist Savita Subramanian notes that the average large-cap fund has a third of its portfolio in just five stocks. It is an increase from 26% in December 2022. Also, a quarter of all large-cap funds have more than 40% of their portfolio in five stocks, up from 5%, according to Subramanian. “Funds’ concentration risks have grown alongside the benchmarks’,” she writes in a note to clients last week. The large influence of these few stocks means the S&P 500 no longer represents “the market", according to Piper Sandler strategists writing to clients.
And this isn’t the first time a relative handful of stocks came to dominate the index. It’s just the most recent and among the most extreme. Prior periods did not end well for investors. Market darlings come and go. Today’s market champions likely won’t dominate in the future if history is our guide. Railroads gave way to automobiles and planes. Chemical conglomerates, telephone companies, and oil giants all had their day in the spotlight. Now it is the turn of a handful of tech giants. Technology may continue as the epicenter of growth in the U.S. economy. Just don’t expect most (any?) of the Magnificent Seven to be a top-ten market cap stock twenty or thirty years from now. Do expect the current Magnificent Seven to underperform the overall stock market in the coming decade because of their current high valuations.
Regards,
Christopher R Norwood, CFA
Chief Market Strategist


