

- Friday's Rally Ran into Selling
- The Risk of Recession is Rising

5-day S&P 500

3-year S&P 500
Market Update
The S&P 500 fell 0.1% last week to finish at 5,460.48. The index closed on Friday almost exactly where it opened on Monday. Two weeks ago, the S&P made all its gains on Monday then declined the rest of the week. Last week the S&P advanced during the first four trading days, hitting a record high of 5,523.64 by 10:15 Friday morning. But then gave it all back during the rest of the trading day. It hit a low of 5,450 at 3:30 p.m. before bouncing 10 points into the close. The trading two weeks ago suggested buyer exhaustion. The trading last week did as well.
Specifically, the market was unable to make any headway following the PCE report. The inflation report showed a 0.0% increase in the Personal Consumption Expenditure index (PCE) for May. It is the first-time prices haven’t increased in six months. Investors should have welcomed the report. And they did for the first 45 minutes of trading. Then sellers showed up. They showed up despite the benign report. They showed up even though the odds of two rate cuts in 2024 increased, according to the CME FedWatch tool. The selling knocked the S&P down 74 points or 1.3%. The index bottomed out at 3:30 p.m. Investors selling the Friday morning rally is another indication that the market may be tiring.
We wrote last week that, “A pullback in the coming week wouldn’t be a surprise.” We still think the odds favor the downside in the short term.
Some pundits attributed the selling on Friday to a growing fear that the economy is slowing. For over a year investors have bought based on the belief that falling inflation would lead to Fed rate cuts. Now it seems investors are growing fearful of why the Fed might start cutting rates. The Fed doesn’t cut rates unless unemployment is rising too fast and far. It doesn’t cut rates unless it thinks a recession is unfolding. “Investors have suddenly shifted their mind-set to looking at the economic data and not just saying this is great that the Fed is going to cut rates, but maybe that we’re going to head into recession,” says Seema Shah, senior global investment strategist at Principal Global Investors.
Norwood Economics is predicting a mild recession starting in the second half of 2024 or first half of 2025. We are no longer in the majority though. The consensus among economists has shifted to recession in the second half of 2025. The moment of truth is approaching. There was always going to be a period of uncertainty. A soft-landing looks like a soft landing until it doesn’t. A soft landing requires the economy to stabilize at a slower growth rate. We’ve arrived at the point where investors need to see the stabilization. Economic growth was only 1.4% in Q1 after all. Some of the data recently has indicated a further softening in the economy. Investors may be starting to wonder how much the economy will slow.
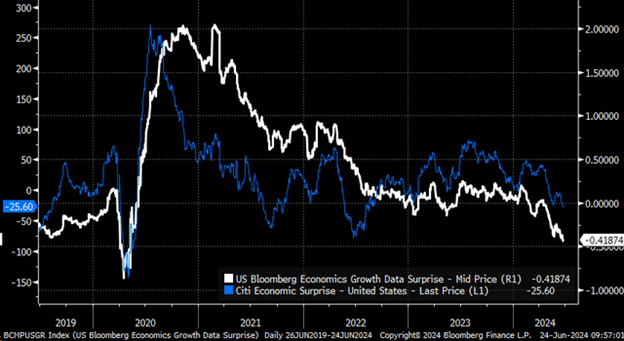
The Citi economic surprise index and the Bloomberg economic growth surprise index have been moving lower since early 2024. They are near levels associated with recession.

The futures market is expecting a significant slowdown in inflation beginning in August (see chart below). One must wonder about corporate pricing power should the slowdown in inflation occur. What's going on with the economy if the inflation rate falls to 2.58% by October as expected? A drop in inflation means falling nominal GDP as well, which will pressure profit margins. Companies will start cutting costs to preserve margins. Most companies’ biggest cost is labor. A rapid fall in pricing power likely means rising unemployment.
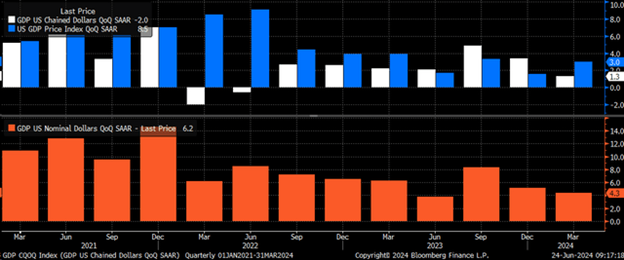
The chart above shows nominal GDP on the bottom in orange. The top bar chart shows the price index in blue and real GDP in white. Slowing nominal GDP can be the result of slower real growth or slower inflation. You calculate nominal GDP by adding the two together. Nominal GDP has trended lower since 2021. It has also been slowing in the last three quarters. What is disturbing is why nominal GDP (revenue) is slowing. Notice the last three white bars. The real GDP growth rate is falling. The blue bars are the price index. The last three blue bars do not show a downtrend. The 64,000 dollar question is whether real GDP will continue to fall or stabilize at a new lower level instead. A second question is whether nominal GDP will continue to fall. Another way to ask that second question is whether the inflation rate will continue to fall. Slower nominal GDP growth due to slower inflation growth means slower corporate revenue growth. Slower revenue growth means slower profit growth.
Investors need to see the economy stabilize at a lower growth rate. They will also need to see if corporate earnings meet expectations. We’ve written about lofty earnings estimates in recent newsletters. The consensus is for 10.6% earnings growth in 2024 followed by 14.1% in 2025. Profit margins will need to rise to hit those estimates given slowing nominal GDP growth.

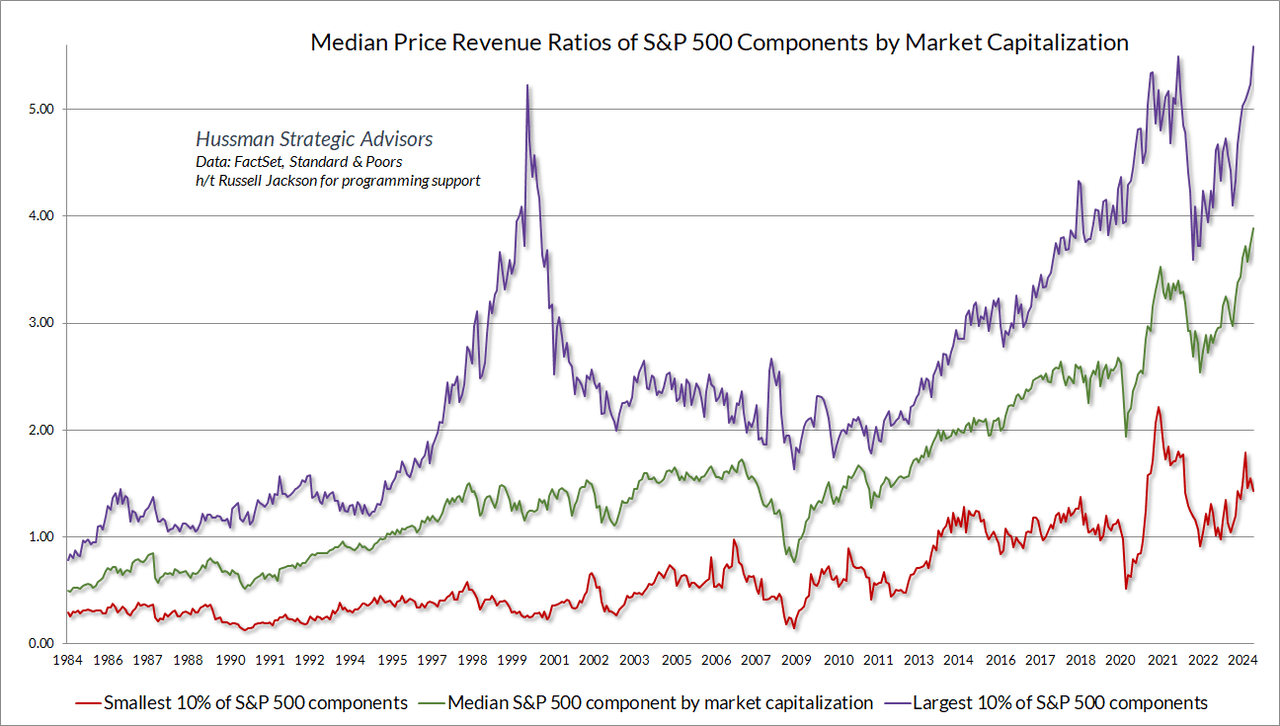
The chart above makes it clear that profit margins are already well above average. It is unlikely that rising profit margins will bail out earnings estimates.
Monetary policy can inform us about the probability of recession as well. Economists seem to be giving the inverted yield curve short shrift these days. They don’t acknowledge that monetary policy works with long and variable lead times. The odds of a recession are high if for no other reason than the inverted yield curve. The yield curve is offset 15 months forward to account for the average lag between inversion and recession. The correlation is high.

Norwood Economics believes the risk of recession is rising. It wouldn’t be a surprise if the stock market begins pricing in a recession in the next few quarters.
Economic Indicators
The increase in inflation in the past 12 months slipped to 2.6% from 2.7%. The Fed’s target is 2%. The core rate strips out food and energy. It rose a scant 0.1% in May. That matches the smallest increase in seven months. The core index is viewed by the Fed and Wall Street as a better predictor of future inflation. The 12-month rate of core inflation decelerated to 2.6% from 2.8% and hit the lowest level since March 2021.
The housing market is still struggling. New homes sales were 619,000 in May, down from 698,000 in April. The S&P Case-Shiller home price index rose 7.2% in April ahead of forecasts for a 7.0% increase. Home affordability is still low.
Initial jobless claims were 233,000 last week, down from 239,000 the prior week. The employment report comes out Friday. Job growth is expected to clock in at 195,000 down from the prior month’s 272,000. The Sahm Rule is at 0.37, below the 0.50 that would signal recession. (The Sahm rule signals the start of a recession when the three-month moving average rises more than 0.5% above the low for the prior 12-months.)
Tactical Asset Allocation
Valuation doesn’t help with timing. It does help forecast expected return. Price determines return over the long run. Paying more for a business than it is worth leads to low returns. Buying a business for less than it is worth leads to high returns. The U.S. stock market has returned around 6.5% per year before inflation since 1871. That 6.5% real return is what investors have demanded to take the risk of investing in U.S. stocks. There are several ways to value stocks that lead to good estimates of future returns. In other words, there are several ways to determine if stocks are cheap or expensive. We’ve written about them in the past.
Price-to-sales is one way to determine if stocks are cheap or expensive.
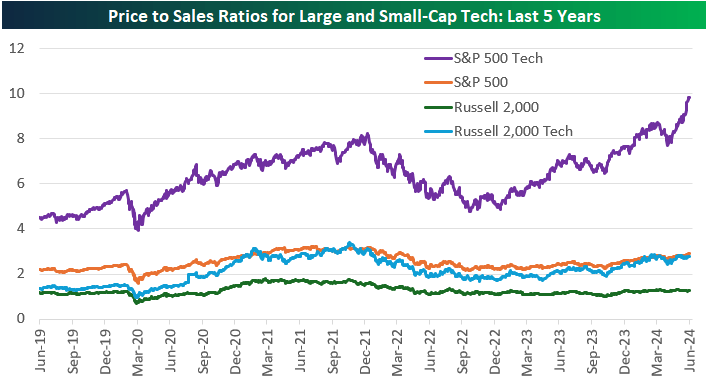
Technology stocks have become expensive during the last five years.
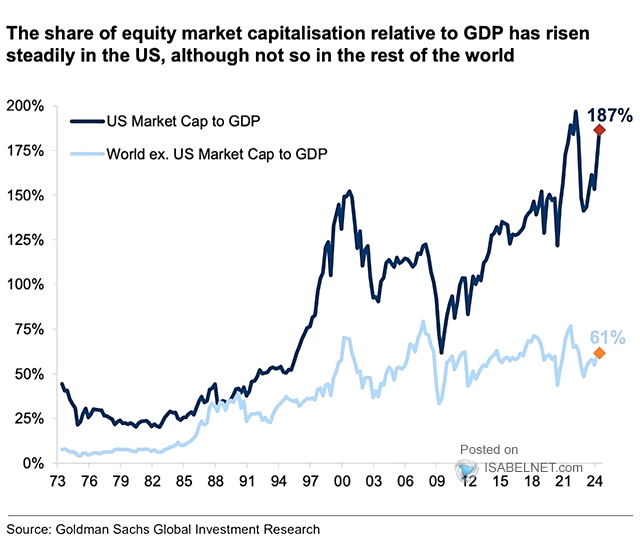
Market Capitalization to Gross Domestic Product is Warren Buffet’s favorite measure of stock market valuation.
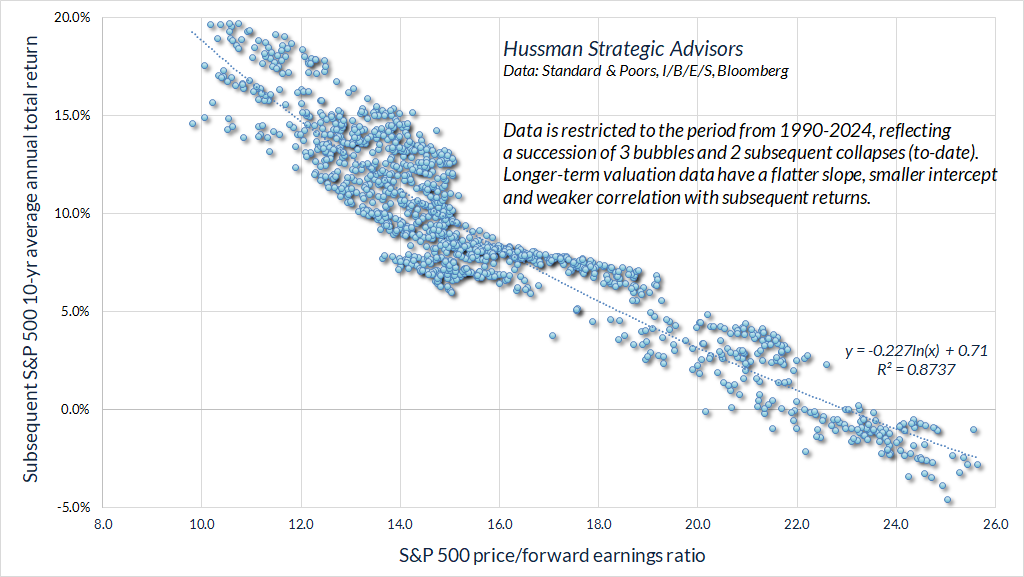
The S&P price/forward earnings ratio has predictive power for subsequent returns. The S&P 500 is currently trading at almost 22x 12-month forward earnings. Investors can expect a 10-year average total return in the low single digits.
Dr. John Hussman has developed a version of market cap to GDP that gives good predictive power for subsequent returns relative to Treasury bonds.

Using his version of market capitalization to GDP allows us to make good estimates of actual subsequent 12-year S&P 500 total return in excess of Treasury Bonds.
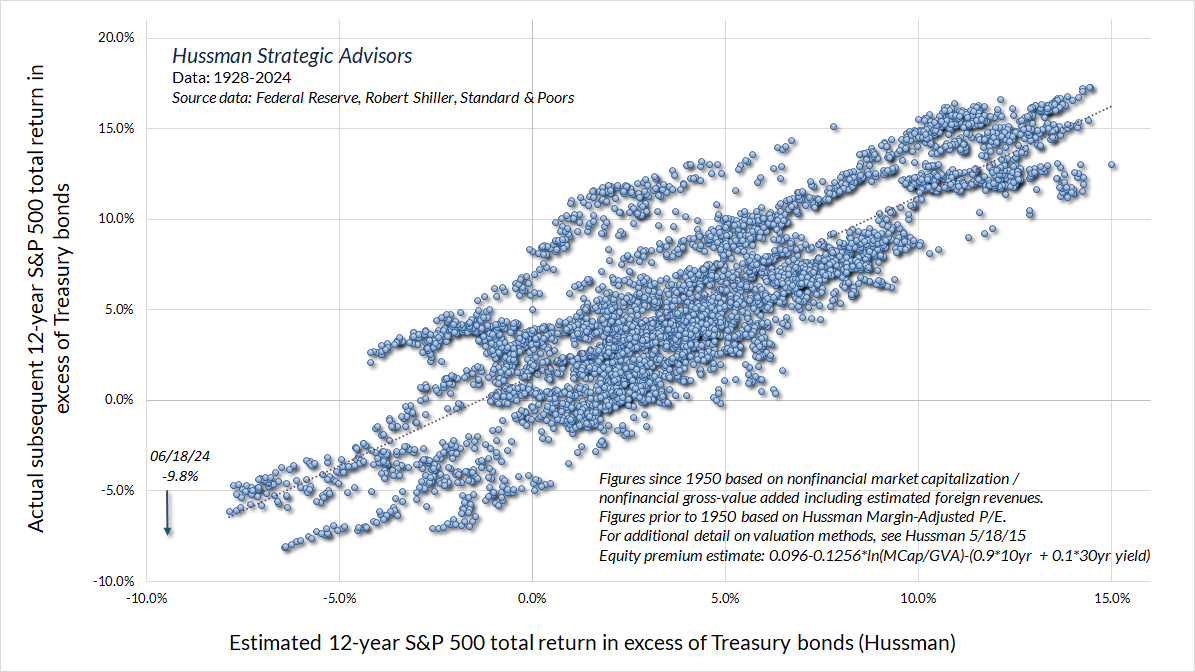
There is a high correlation between Dr. Hussman’s estimates of 12-year returns and actual 12-year returns in excess of Treasury bonds.
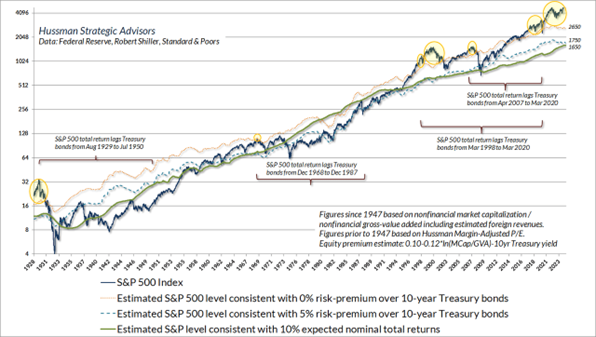
The U.S. stock market is expensive and priced to earn little over the next 12-years. It is also expensive relative to bonds. Tactical asset allocation is based on relative price. Overweight the cheap asset and underweight the expensive one. Overweight stocks relative to bonds when they are inexpensive. Underweight stocks relative to bonds when they are expensive. The equity risk premium is our starting point for determining our allocation to stocks and bonds.
The equity risk premium (ERP) is the return above risk free Treasuries. It has averaged about 4% over the long term. That means that stocks have outperformed bonds by about 4% over the long run. The equity risk premium has varied over time though. For example, the U.S. ERP averaged 5.06% from 1928 to 2022, 4.6% from 1871 to 1925, and 2.9% from 1802 to 1870. The current ERP is close to 0. The S&P 500 has an earnings yield of 4.54% (1/22). The 10-year Treasury bond is trading at 4.39%. We can expect a long period in which S&P returns lag those of Treasury bonds.
Regards,
Christopher R Norwood, CFA
Chief Market Strategist


