

Friday's jobs report means volatility
Market Update
The S&P 500 rose 0.8% to close the week at 4,594.63. The index is up 19.7% year-to-date. The S&P is down 4.6% from its all-time high set on 4 January 2022. It is 0.3% away from the 52-week high reached on 27 July 2022. The equally weighted S&P is up 7% on the year. It showed a loss of 5.4% on the year as recently as 27 October. The Nasdaq was up 0.4% last week. The 10-year Treasury closed the week yielding 4.22%. The 10-year yield fell 0.525% in November. It was the biggest one-month drop since August 2019. Declining interest rates are a big reason the S&P 500 and equally weighted S&P 500 surged higher over the last month.
The 11.6% rise in the S&P in just 24 trading days had all the signs of panic buying (triggered by falling rates). We wrote last week about the index leaving three gaps behind. Large gap-up openings are often a sign of short covering. They always get filled according to Wall Street lore. That would mean a retracement in the index at some point back to the 200-day moving average.
Declining interest rates can be a positive for stocks in the short run. Stocks suffer though if falling rates are in anticipation of a slowing economy. It’s an open question whether long rates are falling only because of slowing inflation. It's possible they are also falling because the economy is expected to slow. And it’s uncertain whether an economic slowdown will morph into a recession. (Norwood Economics believes it will).
Yet for now market momentum is undeniable. The S&P is short-term overbought but hasn’t pulled back. It was due for a pullback last week. It didn’t come. Volume on up days has been greater than volume on down days. That indicates investors are more eager to buy than sell. The VIX is still at 52-week lows indicating that investors don’t feel the need for downside protection. Markets that don’t pull back when they should are markets with momentum. The current market has momentum.
We wrote last week that the S&P was likely to challenge its 52-week high before year-end. It appears we’ll get the 52-week high this week. It also looks likely any pullback won’t come until next year. The Santa Claus rally is a real tendency, and it is right around the corner. Of course, it is possible investors are front-running the Christmas rally. Santa Claus gains would be muted in that case. When the pullback comes watch for support at 4420 (100-day), 4355 (50-day) and 4290 (200-day). The last would take a sell-off of around 6.5%, routine as the ebb and flow of stock markets go.
Interest rate volatility has picked up over the last few years. Rates climbed rapidly in 2022 and the first half of 2023. Rising rates got credit for the sell-off in growth stocks in 2022. They are getting the blame for the poor performance of dividend-paying stocks in 2023. The Fed funds rate is expected to fall over the next few years from its current 5.25% - 5.5%. Falling rates will be a tailwind for the stock market if longer-term rates fall as well. Bank of America economists aren’t so sure they will. Bank of America is projecting the 10-year Treasury note to end both 2024 and 2025 at 4.25%. That is near the current 10-year Treasury yield of 4.22%.
It is unlikely the yield curve will remain inverted indefinitely. The two-year Treasury yield dropped last week to 4.58%. It had been near 5% as recently as two weeks ago. It needs to fall below the 10-year yield for the curve to normalize. The rest of the short end of the curve needs to fall below the 10-year as well. A normalized yield curve where short rates are below long rates isn't enough to reinvigorate the economy. Interest rates won’t help the economy much if the yield curve merely pivots around the 10-year Treasury. The entire curve needs to shift lower. The Bank of America economists don’t see that happening.
Earnings are front and center when it comes to the stock market in 2024. Expectations are high and the market is expensive. Earnings expectations will need to be met or investors will be disappointed. S&P 500 companies did finally grow earnings in Q3 after three straight quarters of losses. Third-quarter net income was 4.1% higher than a year earlier, according to Refinitiv. Earnings per share were up 7.1% due to stock buybacks. Earnings are expected to grow by 11.4% in 2024 even as the economy is expected to slow.
The median call from major Wall Street banks is for a below-average return for stocks in 2024. The median forecast for the S&P 500 is 4,775 by year-end 2024, according to Barron’s. The survey was of 10 equity strategy teams from major banks. The top target is 5,100 with 4,200 at the low end. The market is 4,594.63 as of Friday. That means a return of flat to up 11% for the range of forecasts and a gain of just 3.9% using the median. “Equities are now richly valued with volatility near the historical low, while geopolitical and political risks remain elevated,” according to J.P. Morgan’s Global Equity Strategy report on 2024’s outlook. J.P. Morgan also expects modest global earnings growth. It has an estimate for earnings growth of 2%-3% in 2024 well below the 11.4% consensus. The bank sees S&P earnings of $225 per share in 2024 and has a price target for the S&P of 4,200. J.P. Morgan is at the low end of forecasts.
Uncertainty remains high and risk management a priority.
Economic Indicators
Inflation numbers met expectations with the core PCE rising 0.2% in October, down from 0.3% the prior month. Trimmed mean PCE was 2.7% annualized for October. The trimmed mean measure is the Fed’s preferred measure of inflation. Third quarter GDP was revised up to 5.2% from 4.9%. The Fed needs GDP to slow. The economy can’t grow above potential without it causing inflation, basic economics. The Congressional Budget Office estimates U.S. potential growth at 1.8%. The Atlanta Fed GDPNow tool is forecasting 1.2% GDP growth for Q4. The GDPNow forecast was at 2.1% a week ago. So, the Fed may get what it wants. The question remains whether a slowing economy will stabilize or fall into recession.
The jobs number on Friday could roil the bond and stock markets. The forecast is for 190,000 jobs, up from 150,000 the prior month. It’s estimated that the U.S. needs to create around 100,000 jobs monthly to absorb new entrants into the labor force. Job growth above that number means upward pressure on wages. Productivity gains would be needed to offset rising labor costs. Meanwhile, initial jobless claims were 218,000 last week, up from 211,000 the prior week. Continuing claims rose to 1.93 million, an increase of 86,000. It is the highest level since November 27, 2021, and a potential sign of a (finally) weakening jobs market.
A stronger-than-expected jobs report should result in a sell-off in bonds. Stocks would follow. A weaker-than-expected number will be positive for bonds. The stock market may rise if investors decide a weaker number means Fed cuts sooner. The stock market may fall if investors decide the economy might be in danger of lapsing into recession.
The economy is expected to slow along with inflation. The consensus seems to be for a soft landing. The Fed rate hikes are still working their way through the economy. Fed quantitative tightening is ongoing. Norwood Economics expects a recession in 2024. The coming year will be interesting. We’ll see who's right.
Corporate Earnings Headwinds
The S&P 500 has been the S&P 7 so far this year. The “magnificent seven” mega-cap tech stocks are up over 100% on average. They account for much of the gains in the index. The equally weighted S&P lags far behind the market-cap-weighted S&P. The S&P is expected to earn $246 per share in 2024, up from $209 in 2019, $218 in 2022, and $221 in 2023. The S&P is trading for 21x 2023 earnings. It is trading for 18.7x 2024 earnings. The S&P is trading higher than approximately 95% of its history. High valuations lead to below-average returns.
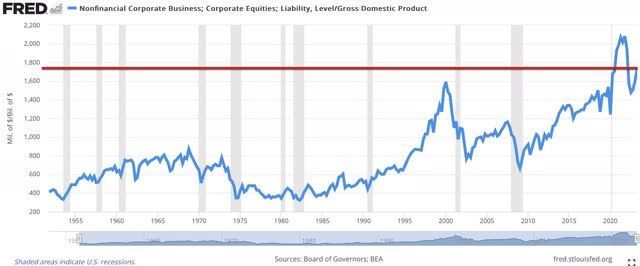
Warren Buffett's favorite stock market valuation metric shows overvaluation
The long-term average P/E ratio is approximately 16x for U.S. large-cap stocks. Using $246 in earnings and a 16x P/E puts fair value at around 3,900 if earnings come through in 2024. Earnings of $230 per S&P share give you a fair value of 3,700. That still requires earnings growth of 4.5%, a reasonable estimate as the economy slows.
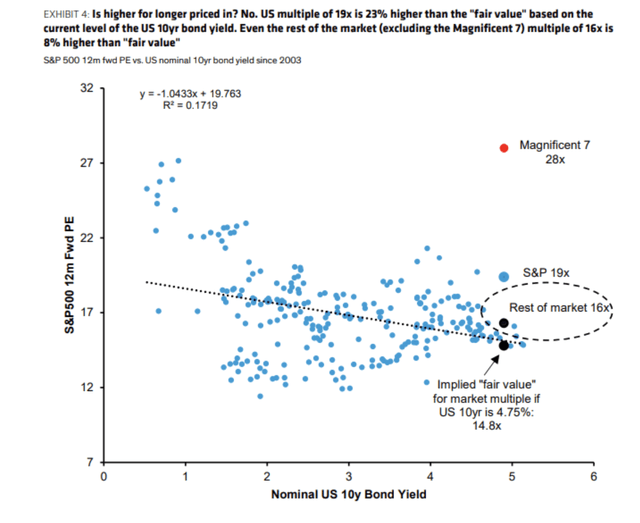
The long-term average P/E ratio is approximately 16x. Fair value is around 15x given the 10-year treasury yield
There is evidence that corporate earnings growth will slow in the coming years as well. Fed economist Michael Smolyansky published a paper on corporate profits in September 2022. His research points to two factors that have elevated corporate earnings growth over the last two decades.
“This note's key finding is that the reduction in interest and tax expenses is responsible for a full one-third of all profit growth for S&P 500 nonfinancial firms over the prior two-decade period,” Smolyansky writes. Corporate taxes have fallen significantly. Interest rates plunged during the Great Recession. They've been at record lows for most of the time since. Corporations were able to elevate after-tax profits with cheap debt and a lower tax burden.
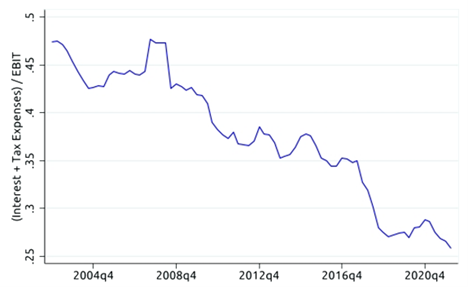
Interest & taxes have fallen relative to earnings before interest & taxes
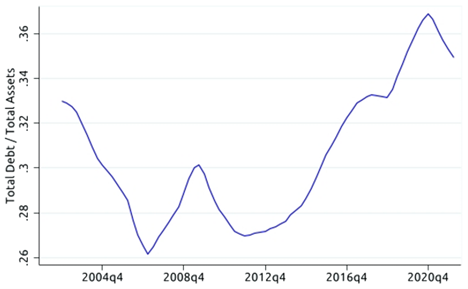
Lower interest rates allowed corporations to increase leverage further boosting profit growth
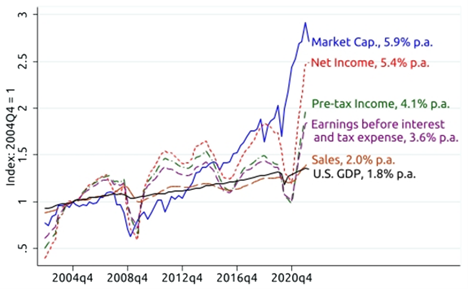
Real profit growth of 3.0-3.5% is likely going forward as reductions in corporate taxes and interest rates no longer turbocharge corporate profits.
Corporate taxes are not going lower. A structural deficit and high debt point to higher taxes being more likely. Also, companies will need to refinance at higher interest rates than in the past. Smolyansky concludes that real corporate profit growth of around 3.0% to 3.5% is likely going forward. Call it 5.0% to 6.5% nominal growth depending on the inflation rate. The S&P will return the same if the price-to-earnings ratio remains at its current level. The S&P's P/E is not likely to do so. Smolyansky points out that the S&P P/E has averaged 16 since 2002. It is now close to 19. The risk is that the S&P P/E will not only return to average but fall to below average. That is because P/E multiples are likely to fall right along with falling earnings growth since investors won’t pay as much for slower earnings growth.
So slower earnings growth means lower returns for stocks. Remember, earnings yield plus earnings growth equals total return. And investors are not likely to pay high earnings multiples for lower earnings growth. Rather they are likely to pay less. A slower-growing stream of earnings multiplied by a lower price-to-earnings ratio means lower returns for stocks. How much lower?
Corporate profit growth of 3.0% to 3.5% plus inflation means the same for stocks assuming a constant earnings multiple. Subtract a couple percent more to account for a lower P/E multiple and it isn’t unreasonable to expect minimal returns from stocks in the coming decade, much as we experienced between 1999 and 2009.
Regards,
Christopher R Norwood, CFA
Chief Market Strategist


