Executive Summary
- The S&P finished the week at 6,013.13
- Volatility is still low despite last week's rise to 18.21
- The tech sector is trailing the S&P
- More stocks are participating in the U.S. stock market gains
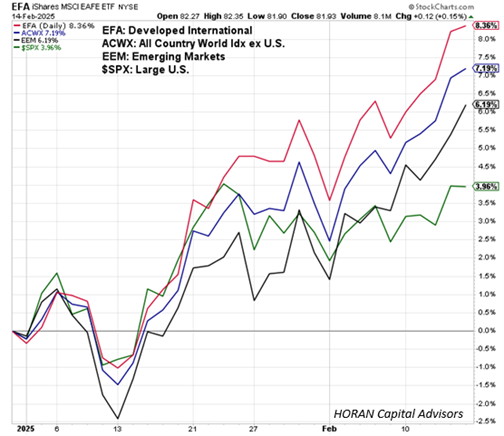
- International & Emerging markets are outperforming the U.S. markets
- Interesting Charts below
The Stock Market
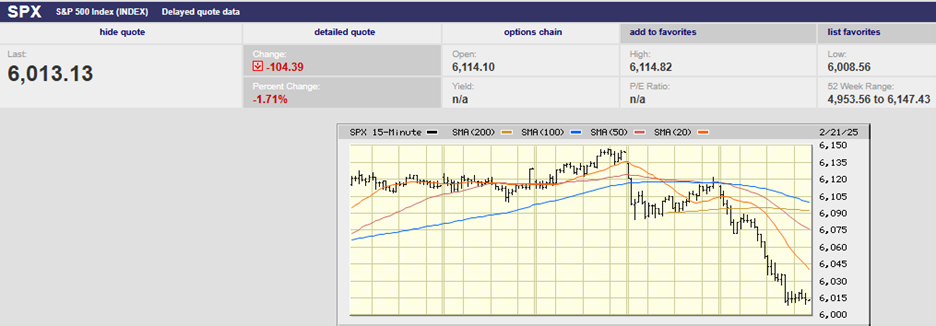
S&P 5-Day Chart
The S&P 500 lost 1.7% last week, finishing at 6,013.13. Friday was a straight-down day with a close near the day’s low. Follow-through selling is likely in the week ahead. The index did hold the 50-day moving average (chart below). The 50-day may provide some support on Monday, at least initially. The Dow Jones Industrial Average had its worst week of the year.
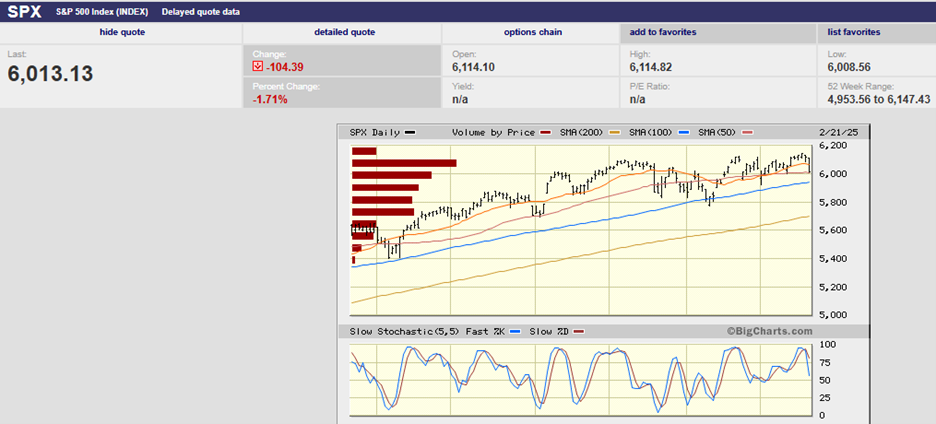
S&P 6-Month Chart
Volatility is still low despite rising last week. The VIX closed the week at 18.21, up from 15.37. The VIX has remained below its long-term average of 20 on a closing basis since December, according to Ulrike Hoffmann-Burchardi, chief investment officer of global equities at UBS Global Wealth Management. The so-called fear gauge has remained in the 15 to 16 range most of the year.
Complacency also has extended to bonds, according to Stan Shipley, Evercore ISI’s fixed-income strategist. “Despite a daily barrage of policy initiatives from Washington and higher readings of economic policy uncertainty, the MOVE index, a metric of implied Treasury volatility, has fallen sharply this year and is near prior low readings over the past two years,” he wrote in a client note on Friday. Given these risks, UBS’ Hoffmann-Burchardi writes, volatility is one asset class that is mispriced, “given the potential political, geopolitical, and technological shifts that are likely to unfold in the months ahead.”
Wall Street is expecting volatility to rise in the coming weeks. High volatility follows low volatility like night follows day. The difference is that the timing is less predictable. The trick is figuring out what will trigger the high volatility. For now, volatility remains low, and the S&P continues to grind higher.
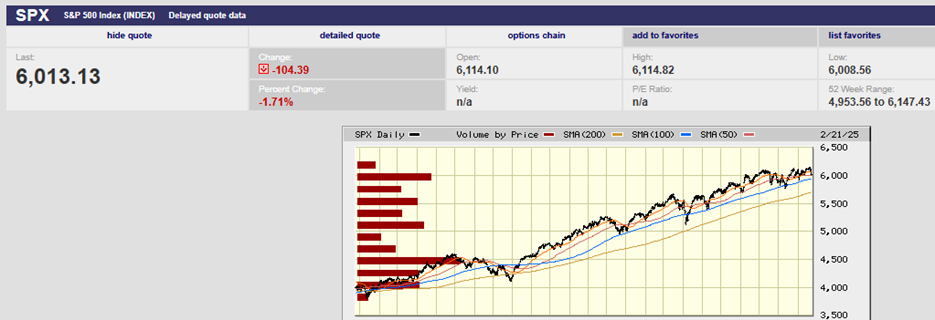
S&P 500 2-Year Chart
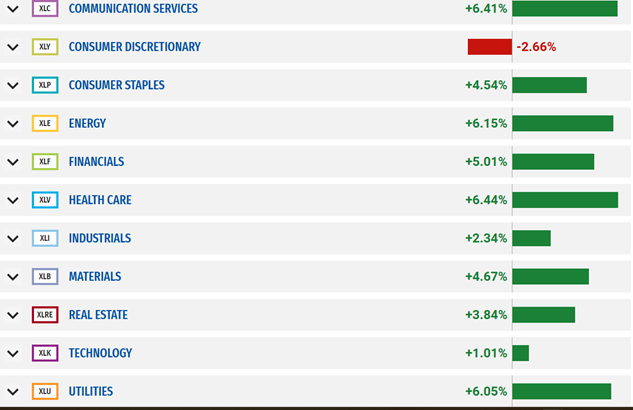
There is change happening underneath the surface of the market though. The Magnificent Seven isn’t so magnificent anymore. The MAGS ETF is down 1.5% year-to-date, trailing the S&P by 3.74%. Also, the tech sector (XLK) is up only 1.01% while the S&P is up 2.24%. Health Care (XLV) is the best-performing sector year-to-date with a return of 6.44%. “Over the past two years, we’ve had healthcare underperform by the largest amount that we have seen in more than three decades,” says Andy Acker, manager of the Janus Henderson Global Life Science fund. “That’s a very unusual situation.”
Energy (XLE) has returned 6.15%. Utilities (XLU) has returned 6.05%. Even stodgy Consumer Staples (XLP) has joined the party with a return of 4.54% year-to-date. Communications Services (XLC) is up 6.41%, but META isn’t leading the sector higher anymore. T-Mobile has returned 20.13% on the year. Fox and AT&T have also outperformed META in 2025.
It appears the concentrated stock returns of 2023/24 may be a thing of the past.
And it isn’t just the 493 forgotten U.S. stocks that are coming to life. International and emerging markets have shown a pulse as well.
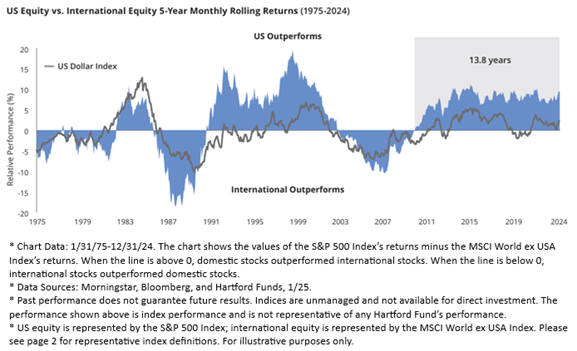
International stocks have been trailing the U.S. for a very long time. Hartford Funds pointed out recently that the U.S. outperformance cycle has been about eight years on average since 1975. The current cycle has U.S. stocks outperforming international stocks for almost fourteen years.
The dismal foreign stock performance has left them trading cheaply. The MSCI EMU index of large- and mid-cap European stocks trades for about 14 times expected 12-month forward earnings. That's less than two-thirds the 22x forward price/earnings multiple of the S&P 500. The U.S. now represents almost 70% of the world’s equity-market valuation but only 25% of the world economy. The disparity between market capitalization and economic size won’t last forever.
The gap is already closing. The Vanguard FTSE Europe ETF (VGK) has returned 10.18% in 2025, while the S&P 500 is only up 2.40%. The iShares MSCI Germany ETF (EWG) has returned an even greater 12.85% this year. The outperformance could continue for a while. There's lots of pessimism about foreign stocks. It won't take much good news to push overseas markets higher. Meanwhile S&P 500 earnings growth estimates are optimistic. The consensus is for earnings growth of 10.1% in 2025 and 14.0% in 2026. Disappointment could pull U.S. markets lower.
And in fact, U.S. earnings growth estimates are falling. The forward 4-quarter estimate ended this week at $270.46, versus last week’s $271.24 and January 3rd’s $272.67. The 12-month forward P/E ratio is now 22.6x vs. 22.2x and January 3rd’s 21.8x.
The S&P 500 earnings yield (inverse of P/E) is now 4.42%, versus 4.5% last week, and 4.6% as of January 3rd 2025. The 10-year Treasury yield is 4.43%. The S&P 500 earnings yield at 4.42% with the 10-year yield at 4.43% means a lot is riding on continued strong earnings growth. Otherwise, it is difficult to justify owning the stock market instead of bonds.
The year is young and trends can change. At the moment though, it looks as if 2025 will break the pattern held in 2023-24. Concentrated performance from a handful of U.S. stocks has been the order of the day. That dynamic appears to be giving way to broader returns in the U.S. It also seems 2025 could see the continued resurgence of foreign stocks, both developed and emerging.
Interesting Charts
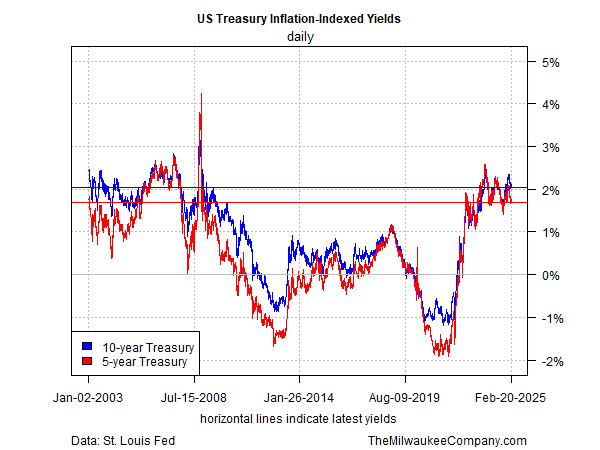
The 10-year real yield is currently 2.05% (Feb. 21), according to treasury.gov. The 5-year real yield is 1.68%. Real yields are as high as they’ve been since the Great Recession. Real yields are the real cost of money. Expensive money means slower economic growth all else equal.
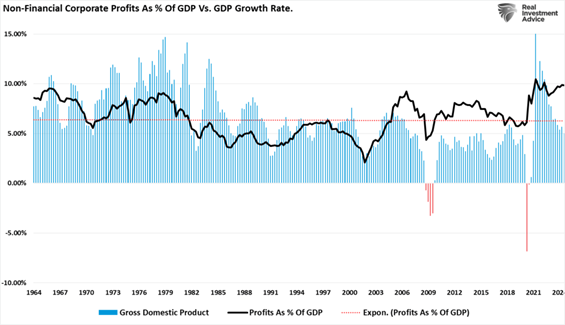
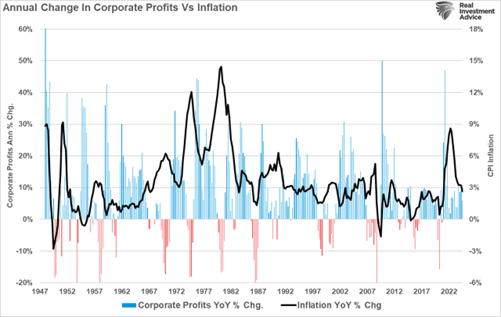
Corporate profit margins are high (black line below). Profit margins are mean reverting. Declining profit margins would lead to earnings growth disappointment in the U.S. in 2025.
Falling inflation should mean falling profit growth (chart below).
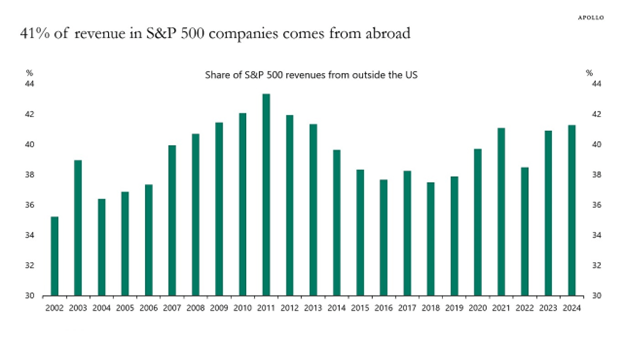
S&P 500 companies get a large percentage of revenue from overseas. Tariffs will make U.S. exports more expensive if other countries retaliate.
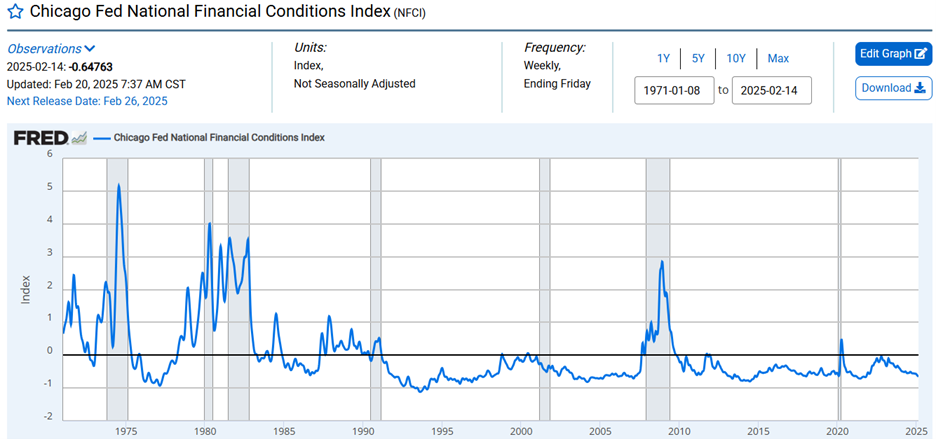
Offsetting at least some of those headwinds, financial conditions remain loose (chart below). A negative number means financial conditions are looser than average. You will note that financial conditions have been looser than average for most of the last 35 years. It's also worth noting that cheap money leads to high debt.
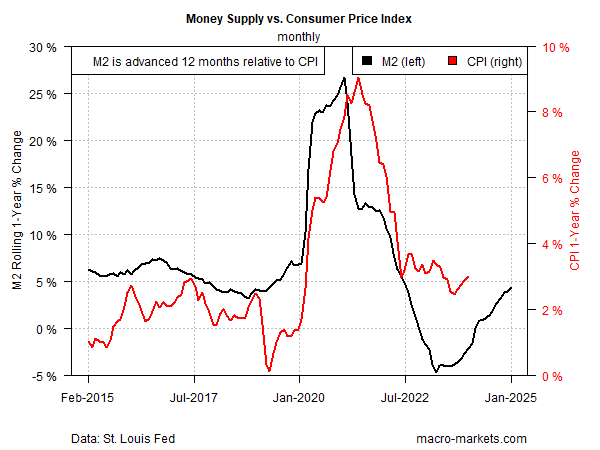
The money supply is growing again. (black line in chart below)
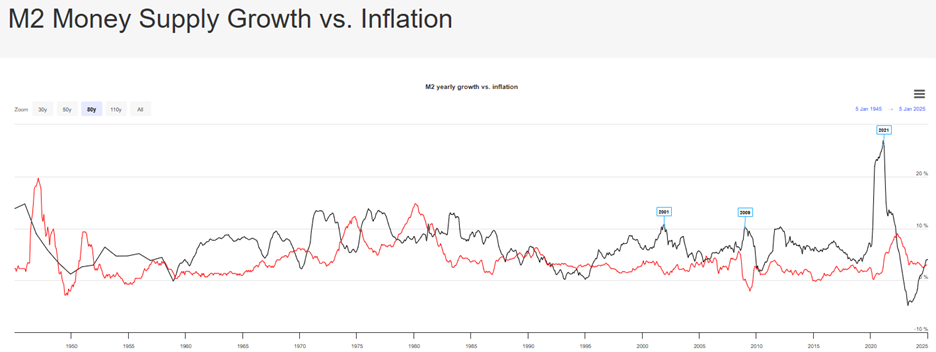
Money supply growth impacts inflation according to the Quantity Theory of Money. The chart below shifts M2 growth forward 12 months. In other words, M2 growth impacts inflation with about a 12-month lag.
The Federal Reserve is signaling that it’s on hold. It almost certainly should be.
Regards,
Christopher R Norwood, CFA
Chief Market Strategist