Executive Summary
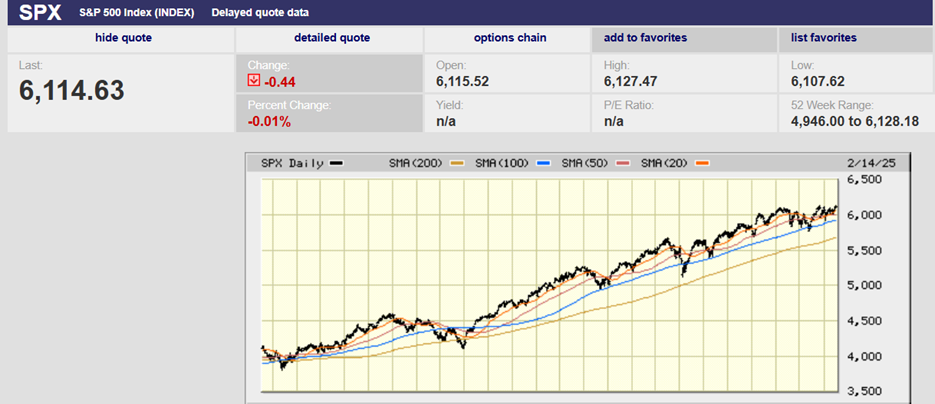
- The S&P finished the week at 6,114.69
- The 2-year yield hit 4.38% after the Consumer Price Index (CPI) was released on Wednesday, but ended the week at 4.27%
- Investors dumped stocks when the CPI report was released
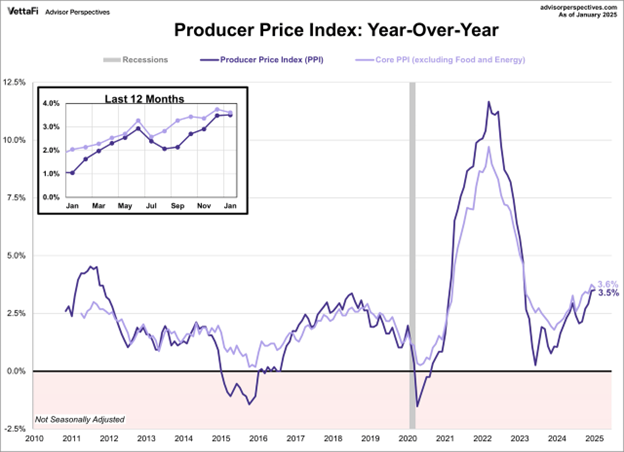
- Producer Price Index (PPI) has accelerated for five straight months
- PPI is a leading indicator of consumer inflation
- Inflation expectations are rising among fixed-income investors
- The 5- &10-year breakevens are rising
The Stock Market
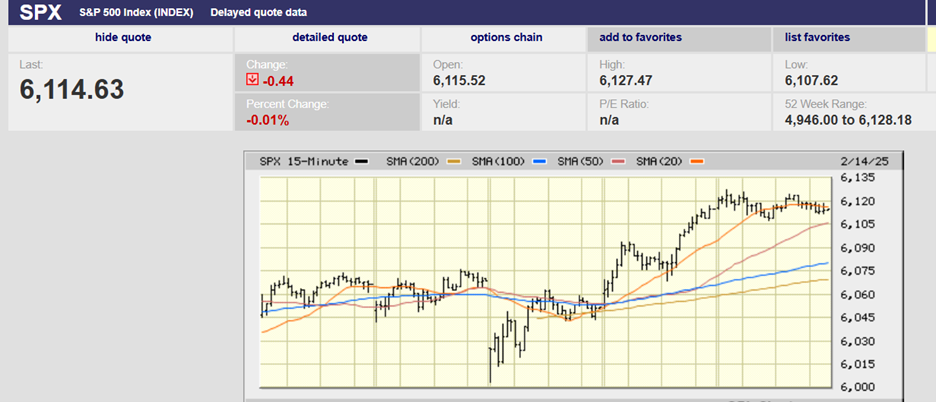
S&P 5-Day Chart
The S&P 500 rose 1.5% last week, closing at 6,114.69. The index has worked through resistance in the 6,000 – 6,100 area. It looks like it is poised to break out to a new high. The coming holiday-shortened week could see the resumption of the bull market uptrend. The S&P need only clear the intra-day high of 6,128.18 reached on 24 January.
The 2-year Treasury yield ended the week at 4.27% after rising earlier in the week. The 2-year yield hit 4.38% after the Consumer Price Index (CPI) was released on Wednesday. The CPI report showed higher-than-expected inflation. The 10-year yield ended the week at 4.48% after bouncing to 4.64% following the CPI report. The 2-year yield hadn’t hit 4.38% since 14 January. The 10-year hadn’t seen 4.64% since the 24th of January. Yields are still rising in other words. Or as Barron’s put it, “As inflation data heats up investors are dumping bonds in response, which has in turn propped yields up across the curve.”
Investors dumped stocks as well when the CPI report was released. The futures market tanked, and the cash market opened lower. The S&P lost 1% at the open, falling to 6,003 in early trading Wednesday. The index recovered quickly though and closed the day at 6,051.97. The intra-day volatility was caused by the CPI report. The CPI M/M jumped to +0.5% compared to the forecasted +0.3%. Core CPI M/M rose by +0.4% versus the consensus level of +0.3%.
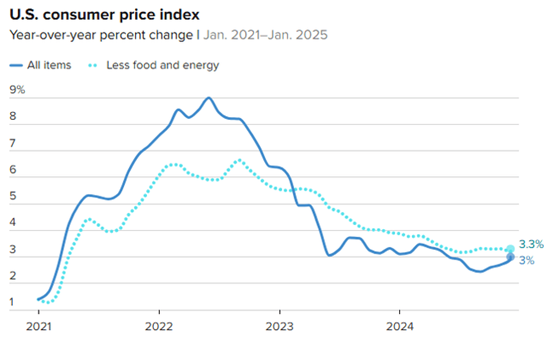
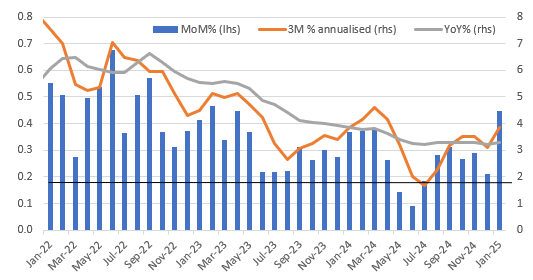
In fact, the core CPI reading of 0.4% wasn’t that far away from 0.5%. The core number to three decimal points was 0.446%. Four more ticks up and the print would have been rounded to 0.5%. The chart below shows that this is a clear deterioration from the recent trend. It is the highest MoM core inflation print for two years.
The Producer Price Index (PPI) report was released on Thursday. Wholesale inflation remained hot in January, rising more than expected. PPI has accelerated for five straight months. It is currently at its highest level since February 2023.
PPI is a leading indicator of consumer inflation. That’s because producers raise prices in response to rising costs. PPI inflation is running around 3.5% year-over-year. The month-on-month readings for January are annualizing to around 4%.
The producer price index for final demand was up 0.4% month-over-month, higher than the 0.3% forecast. On an annual basis, headline PPI increased 3.5%, above the 3.2% forecast. Core PPI, which excludes food and energy, increased 0.3% in January, as expected. Year-over-year, core PPI eased to 3.6% from 3.7% in December but remained above the projected 3.3% growth.
The futures market is now signaling expectations of only one Fed funds rate cut in 2025. Even one cut is likely too many given current inflation data. And there is a cost to the Fed cutting again. Any cuts at this point could increase inflation fears among investors. “If the Fed cuts interest rates too early, it increases the likelihood that we will see a repeat of the 1970s,” writes Torsten Sløk, chief economist at Apollo Global Management. The Fed notoriously cut rates in the 1970s as an initial bout of high inflation was subsiding. The rate cuts led to a rebound in inflation that forced the Fed to start raising rates again.

Inflation expectations are rising among fixed-income investors. The five-year breakeven rate has risen sharply since the Fed began cutting last September.
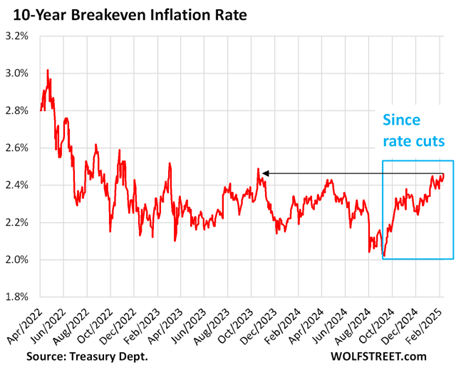
The 10-year Breakeven has been rising sharply as well.
Rising long-term rates have caught fixed-income investors by surprise. The blueprint for an easing cycle has been the same for some forty years. The Fed cuts the funds rate and the entire yield curve falls. The short end falls more than the long end causing the curve to steepen. It’s known as a bull steepener because rates falling along the curve is good for the economy and for stocks. This time investors are facing a bear steepener. The short end of the yield curve has fallen but the long end is rising. We’ve been writing about the 10-year Treasury yield rising for a few months. A bear steepener is not good for the economy and stocks.
Interest rates are rising because the bond market fears a return of inflation. They have also been rising because the government has been borrowing huge amounts of money since Covid. The current year's deficit is projected to be almost $2 trillion. All that borrowing is pushing interest rates higher. It is basic economics. As the supply of bonds rises, the price falls (yields rise). The large deficits appear here to stay. Trump’s cost-cutting moves are peanuts compared to what is needed.
A summation from Barron’s:
To save $100 billion annually, one-tenth of the $1 trillion of cost cuts bruited by Musk—would mean sacking a quarter of the federal workforce, some 750,000 employees, according to an analysis by Macquarie economists David Doyle, Chinara Azizova, and Ric Deverell. To realize the $1 trillion goal would require a 30% reduction in non-defense spending (excluding entitlements such as Social Security, Medicare, and Medicaid); a 15% cut in defense outlays; and a 15% cut in social spending such as entitlements.
The cost-cutting to date has been inconsequential. The 75,000 workers who reportedly have accepted buyouts represent about 2.5% of the federal workforce, according to Ned Davis Research. The research firm estimates savings of $15 billion out of the $650 billion in employee compensation. “In the context of $7.0 trillion total federal outlays, however, the expected savings are a drop in the bucket,” Ned Davis notes.
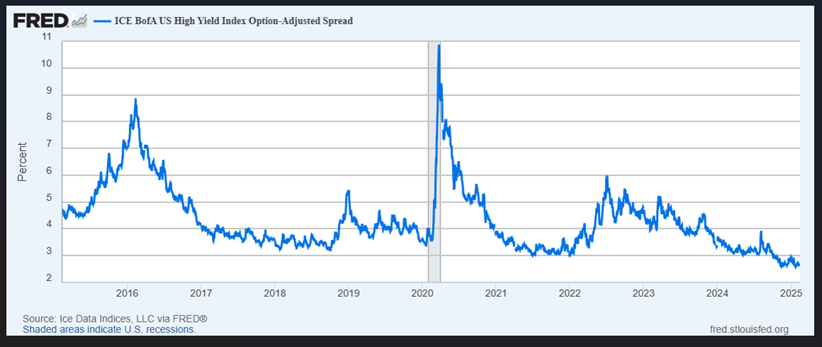
There is uncertainty surrounding fiscal policy, tariffs, and foreign policy. But, the earnings season has been solid so far. The jobs market is strong, real final sales as well. Corporate spreads are tight. Liquidity is plentiful. The Volatility Index has fallen to 14.77, a level indicating a lack of fear that often precedes a pullback. The stock market is still trading sideways over the short term though. And the trend is still up longer term.
A correction would be normal in the coming months but there is no sign of an end to the uptrend that began in the fall of 2022.
Regards,
Christopher R Norwood, CFA
Chief Market Strategist