Executive Summary
- The S&P finished the week at 6025.99
- The S&P has been trading sideways since 11 November
- Volatility (VIX) has spiked five times since last fall each time falling quickly back to mid-teen levels
- Microsoft, Alphabet, and Amazon have contributed to the negative tone with cautious guidance
- The Equity Risk Premium has been falling over the last 14 years
- Bonds have been a horrible investment over the last three, five, and ten years
- The jobs market continues to show strength
- Consumers' inflation expectations are increasing
- The stock market is expensive and will return less than its long-term average over the next decade
- Good stock picking will be critical if investors are to earn a return close to the long run average.
- The equity risk premium is too low which may make Treasury bonds a better investment than stocks on a risk adjusted basis over the next decade.
- Treasury bonds may outperform stocks over the next decade but not necessarily over the next few years since the 10-Year could rise another 100 basis points in the short term.
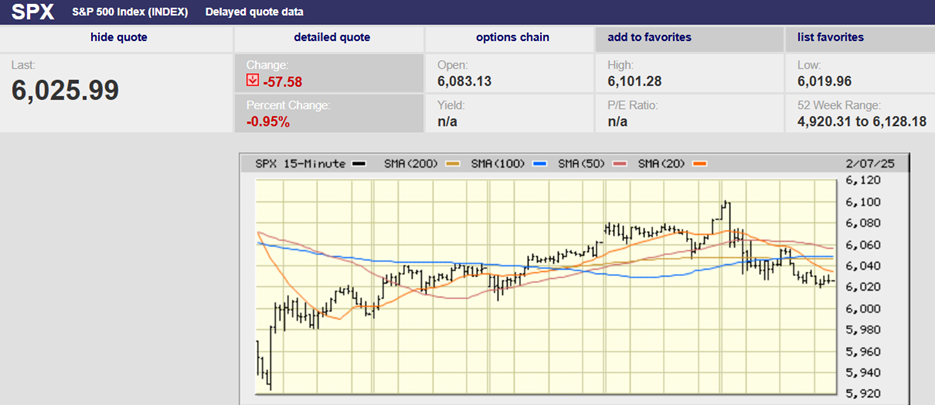
The Stock Market
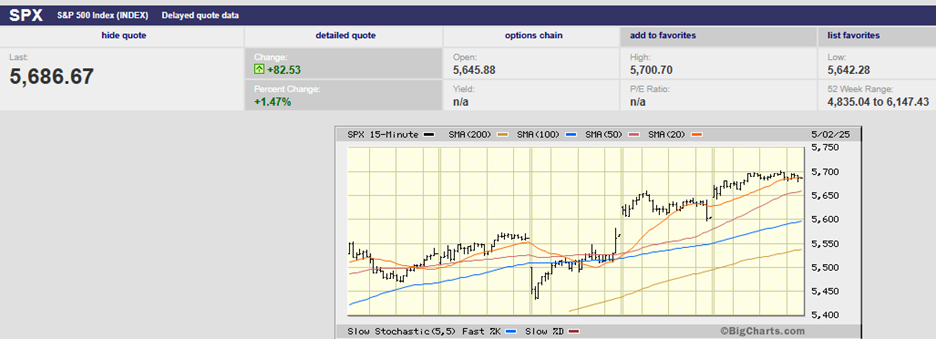
S&P 5-Day Chart
The S&P 500 spent another week going nowhere. The index fell 0.2%, finishing the week at 6025.99. The S&P is up 5.5% since the election. But it's gone sideways since 11 November. The action has been two steps forward two steps back. The S&P hit a high of 6,017.31 on 11 November before retreating a couple of percent. It also hit highs of 6,099.97 on 6 December and 6,128.18 on 24 January but couldn't maintain those levels. The 24 January high was followed by two failed runs at all-time highs. The first run petered out after hitting 6,120.91 on 31 January. The second run was Friday's 6,101.28 high. The S&P hit its high on Friday early but finished near its low. The early high and late low favors selling in the week ahead.
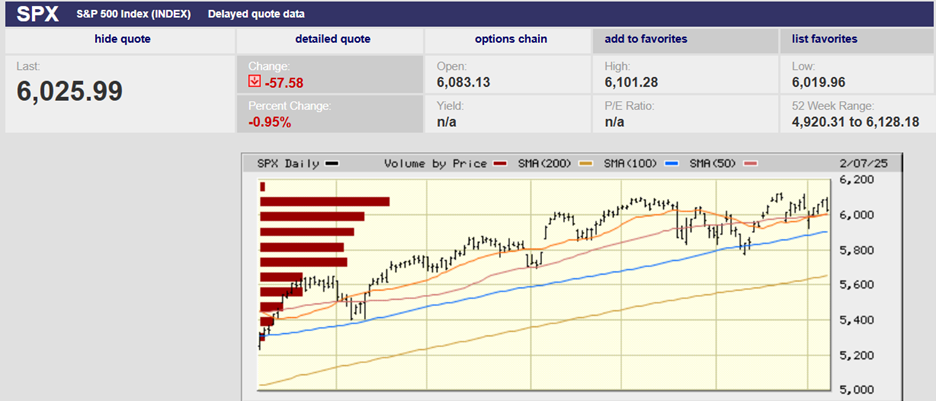
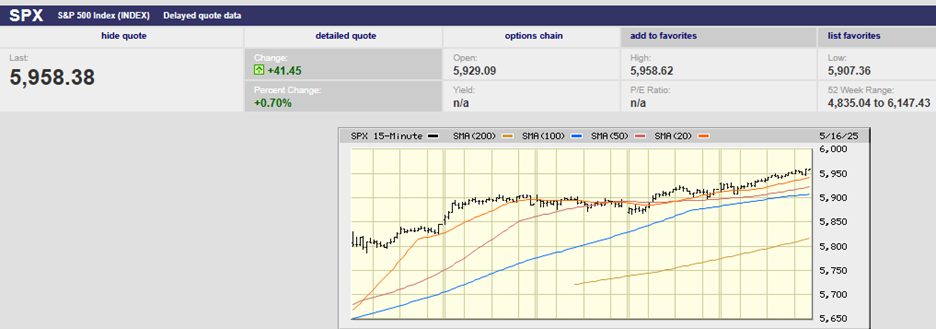
S&P 500 6-Month Chart
The rising 200-day moving average means the main trend is still up. The S&P has also held the 20-day and 50-day moving averages, although barely. The index closed right above both the 20- and 50-day on Friday. We wrote a few weeks ago in Volume 313 that the market may move sideways for a couple of months
“The mechanical nature of the price action means the possibility of a trading range. The S&P might well work between 5,800 and 6,100 for at least the next couple of weeks. The S&P might even move sideways for the next few months as fundamentals sort themselves out. The earnings season is the biggest fundamental that needs sorting currently.”
It’s been a few weeks now and the S&P has indeed trended sideways. The uncertainty surrounding earnings, interest rates and international trade has stymied the market. Investors aren’t sure what to do. Volatility (VIX) has spiked five times since last fall. Each time falling quickly back to mid-teen levels.
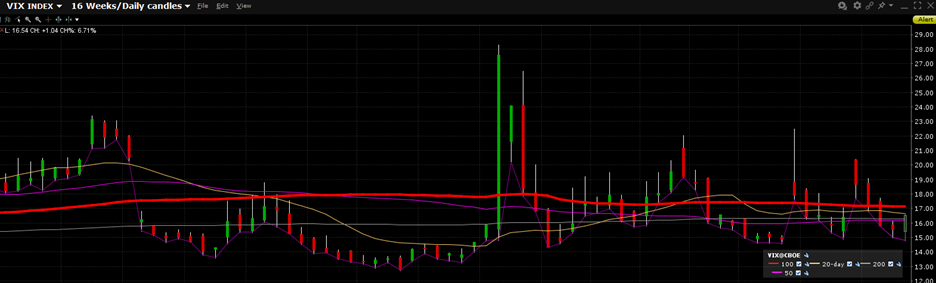
The VIX is also known as the fear gauge. It measures expected volatility over the next 30-day period. Investors use VIX to hedge their investment positions. Real money is at risk. A VIX in the mid-teens means investors aren’t particularly worried. A spike into the 20s means they are. A spike into the 30s or higher usually accompanies a bottom after an extended sell off. The December 18th spike to 28.32 was the result of the Fed’s hawkish announcement about rate cuts going forward.
Actual volatility hasn’t lived up to expected volatility. The VVIX is a measure of the volatility of the VIX. “A sort of fear of fear index,” as Barron’s writes. The VVIX has risen to 99.04 since the election from an average of 88.97 during Trump’s first term. Investors are anticipating increased volatility. But they haven’t gotten it yet. Still, the VIX has spiked five times into the 20s since last fall. Investors are on edge. Skittish investors make it less likely that a meaningful down draft is in store for the S&P 500 any time soon. Bull market’s climb a proverbial “wall of worry”. Selloffs usually occur when investors are not so fearful.
Earning’s season isn’t helping investor sentiment. Expectations were high. They’ve started to come down. The forward 4-quarter S&P 500 EPS estimate fell to $271.24 last week from $273.33 the prior week, according to Brian Gilmartin, CFA. Microsoft, Alphabet, and Amazon contributed to the negative tone with cautious guidance. Microsoft lowered revenue guidance for the 2nd quarter in a row. Alphabet reported cloud growth slowed. Amazon guided for $153 billion in Q1 2025 revenue, below the consensus estimate of $156 billion. All three stocks ended the week lower. S&P 500 earnings estimates for 2025 are at $271.7 per share, which would be 10.4% earnings growth.
The S&P 500 is trading at 22.2x 12-month forward EPS. The long-run average is around 16.5. Stocks are priced for strong earnings growth. Any sign that earnings growth is faltering will pressure stocks. The equity risk premium is the extra return investors require to take on the risk of owning stocks. The equity risk premium has been falling over the last 14 years or so. (see chart below).
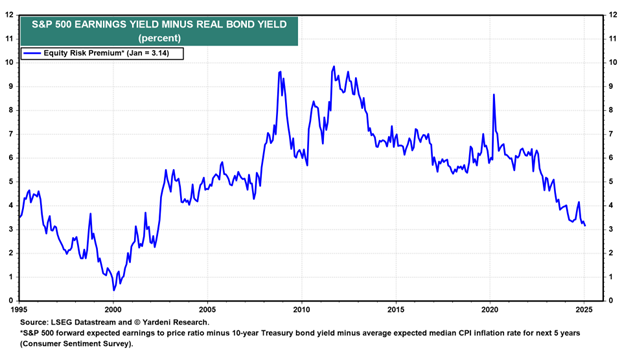
The equity risk premium may be even lower than Ed Yardeni’s model (chart above) suggests.
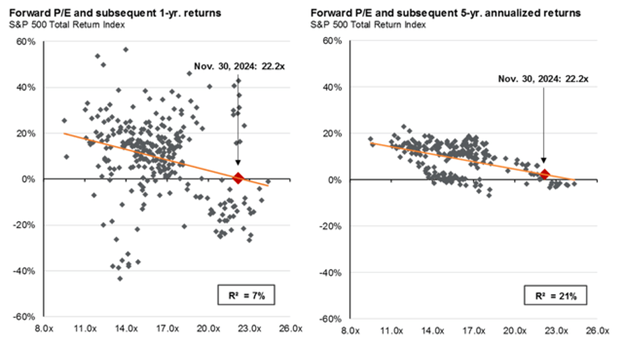
Historical performance using forward P/Es shows the S&P 500 is likely to earn little over the next five years (chart above).
The equity risk premium is even lower using Dr. John Hussman’s model. There is a high correlation between the expected 12-year S&P 500 annual total return in excess of Treasury bonds and the actual 12-year return. (chart below)
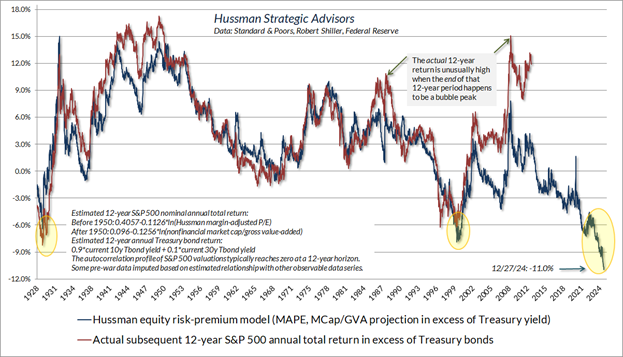
Actual 12-year returns (red line) trail the forecast returns (blue line) because it is a 12-year forecast.
Dr John Hussman writes about the above chart in his latest commentary: “I realize that a shortfall of negative 11.0% versus bonds seems preposterous and implausible, though I haven’t been a stranger to seemingly preposterous and implausible estimates at the extremes of previous market cycles over the past 40 years.”
Bonds have been a horrible investment over the last three, five, and ten years. The chart below is the iShares 20+ Year Treasury Bond ETF (TLT). Bond prices fall as yields rise.
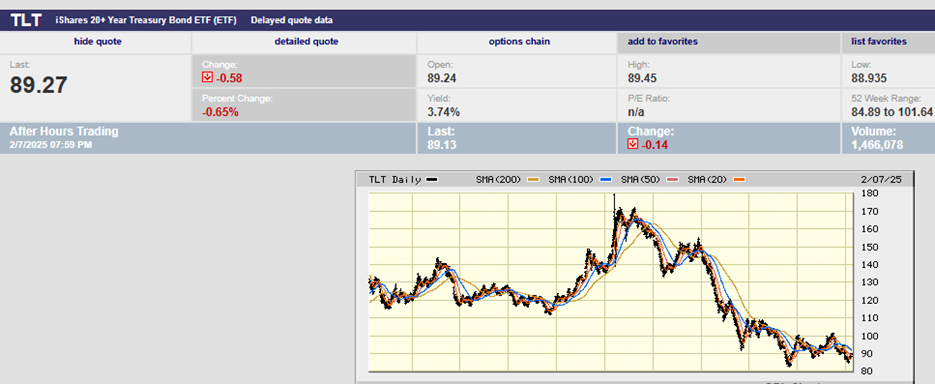
TLT 10-Year Chart
TLT has returned negative 10.83% yearly over the last three years. It has lost 6.79% on average over the last five years. And it has lost 1.29% annually over the last 10 years. Short-term Treasury returns were 1.86%, 1.32%, and 1.35% over the three-, five- and ten-year periods. Better but nowhere near keeping up with inflation. Bonds have been a loser for the last 10 years. The question is how will they do over the next ten years?
Bonds outperforming stocks over the next decade isn’t so hard to believe. Stocks are at extreme valuations after 15 years of above average returns. Bonds have been a loser for the last decade. Reversion to the mean is a hallmark of investing. Stocks underperforming and bonds outperforming is highly likely…at some point.
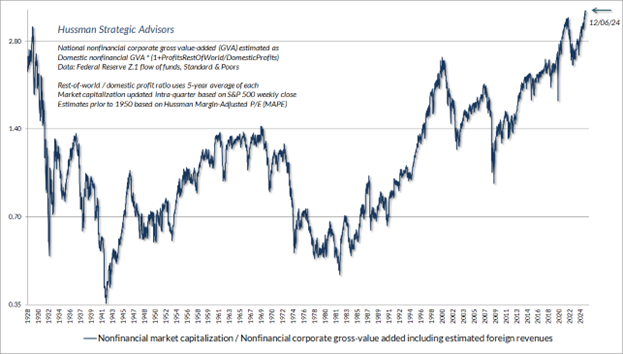
Dr Hussman’s preferred measure is market capitalization to corporate gross value added (above)
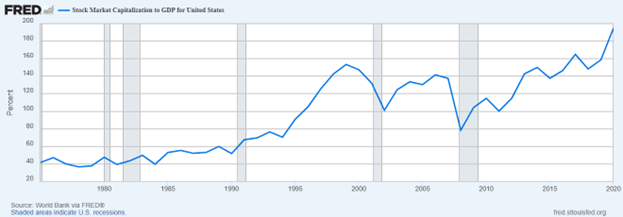
Stock Market Capitalization to GDP is Buffet’s favorite indicator.
But bonds outperforming stocks doesn't mean bonds will necessarily perform well on an absolute basis.
That’s at least partly because inflation is likely to remain a problem for the foreseeable future. Currently bonds seem to be pricing in more inflation ahead. The yield on the 10-year Treasury note was back up to 4.5% on Friday, after falling to 4.4% on Wednesday. Rising yields means falling bond prices.
There is reason to believe that yields will continue to rise. The jobs market continues to show strength. Payroll data out Friday was solid with the U.S. creating 143,000 jobs in January. The prior month’s number was revised higher to 307,000 from 256,000. Average earnings increased 0.5% month over month. Year over year earnings rose by 4.1%, up from 3.8% the prior month.
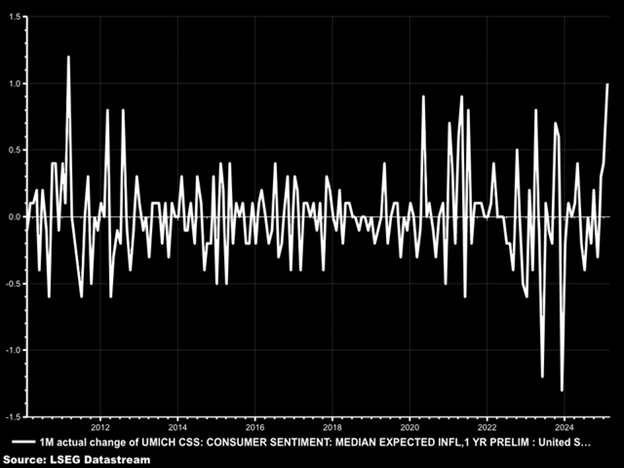
More significantly, consumers' inflation expectations are increasing. (chart below) The University of Michigan’s one-year inflation expectations survey rose to 4.3% from last month’s 3.3%. That is a sharp increase in inflation expectations. Economists understand that rising inflation expectations can cause higher inflation.
Q4 productivity also brought bad news for inflation. Productivity dropped to 1.2% from 2.2% the prior quarter. Rising wages and declining productivity mean higher wage inflation. Labor is the biggest cost for most businesses.
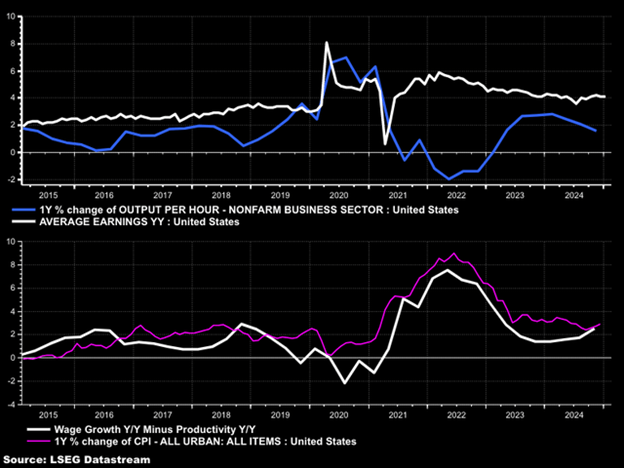
Wage growth Y/Y Minus Productivity has turned up (white line). Inflation may be turning up as well (violet line)
The December Fed Fund Futures contract is trading at 3.98%, points out Mott Capital. That suggests the market is now pricing in one rate cut in 2025. The 3-month Treasury bill 1-year forward contract is trading 0.003% below the spot Treasury 3-month bill rate. That suggests no rate cuts in 2025.
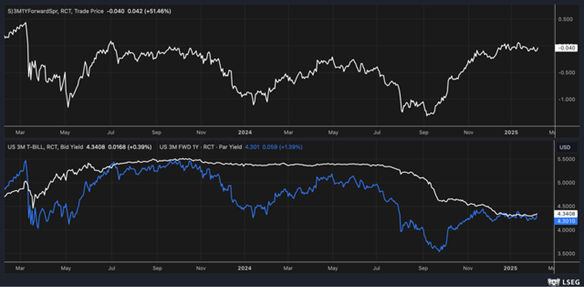
The one-year forward yield for the 3-month T bill (blue line chart above) is only 0.003% below the current 3-month T bill (white line)
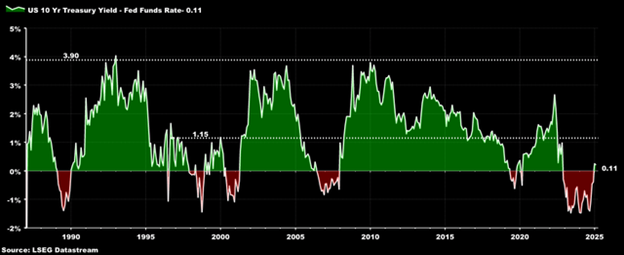
The 10-year Treasury is likely to rise from its current 4.5% yield if the Fed is one cut away from being done or already done for that matter. At least if history is any guide. The 10-Year typically yields 1% to 2% above the Fed funds rate. The 10-year yield could rise to between 5.0% and 6.0% if the Fed cuts just one more time.
So, what does it all mean?
- The stock market is expensive and will return less than its long-term average over the next decade.
- Good stock picking will be critical if investors are to earn a return close to the long run average.
- The equity risk premium is too low which may make Treasury bonds a better investment than stocks on a risk adjusted basis over the next decade.
- Treasury bonds may outperform stocks over the next decade but not necessarily over the next few years since the 10-Year could rise another 100 basis points in the short term.
None of this is advice or a recommendation. Past performance is no guarantee of future results. Investing can and does involve the loss of principal, even for short periods of time.
Regards,
Christopher R Norwood, CFA
Chief Market Strategist