Executive Summary
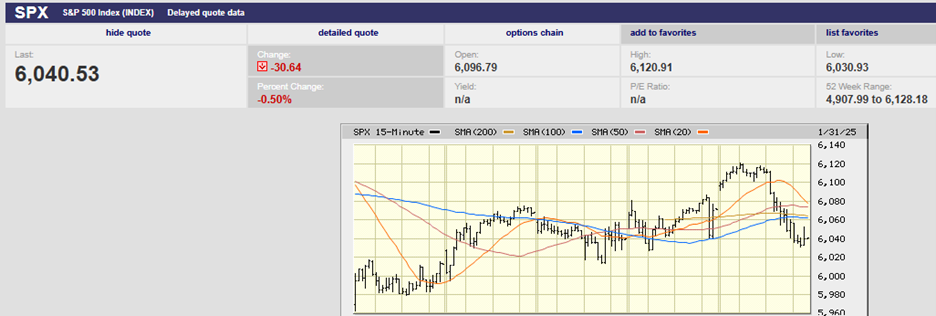
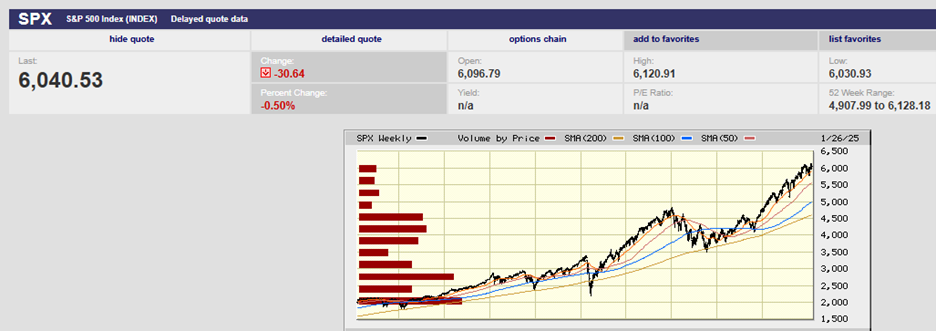
- The S&P fell 1% last week, closing Friday at 6,040.53
- The index hasn’t been able to break clear of resistance
- The AI space took a big hit Monday
- Tariffs on Canada, Mexico, and China
- GDP grew 2.3% annually in Q4
- The futures market expected the funds rate to remain at 4.25-4.50% and it did
- The employment cost index (ECI) for Q4 2024 rose 0.9% QoQ
- Pending home sales took a hit in December
- The stock market continues to trend higher
- There is a relationship between the stock market and the economy
- More Interesting Charts to review
The Stock Market
The S&P 500 fell 1% last week, closing Friday at 6,040.53. Despite setting a record high a week ago Thursday, the index hasn’t been able to break clear of resistance. Chart resistance runs from 6,000 to 6,100. Additionally, the index is trading near the upper boundary of two different channels. The first upper boundary is around 6,150.
The S&P gapped down at the open on Monday. The big news was about DeepSeek, an AI company that claims to have built a cheaper mouse trap. There may be less than meets the eye to DeepSeek’s AI model though, that’s still to be determined. Meanwhile, the AI space took a big hit Monday with Nvidia falling around 17% on the day. The S&P bottomed early at 5,962.92. It recovered throughout the week until the advance ran into selling on Friday around 1 p.m. The index got as high as 6,120.91 before running into selling.
S&P 500 5-day chart
U.S. stock indices ended in the red Friday. The media pointed the finger at tariff talk coming from the White House. The White House's press secretary said Trump's proposed 25% tariffs on Canada and Mexico, and a 10% tariff on China would take effect on February 1st. January saw the S&P 500 gain 2.7% despite last week's decline. The Nasdaq rose 1.6% and the Dow gained 4.7% in the month. The 10-year Treasury yield finished the week at 4.54%. The 2-year yield ended at 4.21%.
The economy remains strong. The GDP report out last week didn’t match the 2.5% consensus forecast, but the economy still grew 2.3%. What’s more, the headline number understated the strength in consumer spending. Consumer spending accounts for about two-thirds of the U.S. economy. Spending picked up in the final three months of 2024, increasing 4.2% at an annual rate. It was the strongest pace in almost two years and well above the preceding quarter’s 3.7%. “The consumer spending trends are healthy globally," said John Belton, Gabelli Funds' managing director for growth portfolios. The GDP number was also affected by a weak net exports number. That in turn was due to importers front running the imposition of Trump’s tariffs. Net exports should rebound in the next few quarters. Inventories were also drawn down during Q4, reducing Q4 GDP. Tight inventories will likely provide a boost to GDP in the coming quarters. Companies will need to restock as consumers continue to spend.
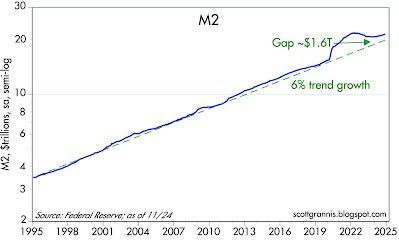
The FOMC announced no change in the Fed funds rate on Wednesday. The futures market expected the funds rate to remain at 4.25-4.50%. Investors weren't disappointed. The FOMC will also continue Quantitative Tightening (QT). The Fed will continue reducing its holdings of Treasury and Mortgage-Backed Securities, likely at least until June. So far, the Fed has shrunk its balance sheet by around $2 trillion. They have a ways to go to get back to trend growth in M2 which means there is still plenty of liquidity in the economy.
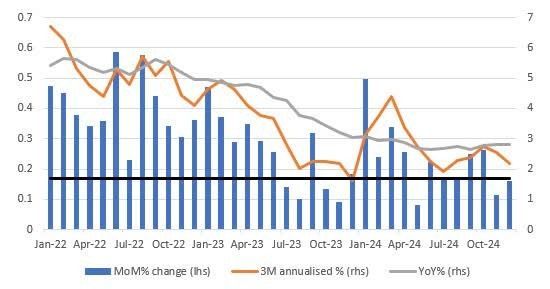
Core PCE is the Fed's preferred inflation measure. It rose 0.2%MoM/2.8%YoY in December as consensus predicted. Better yet, core PCE rose 0.159% using three decimal places. That's below the 0.17% month-on-month needed to deliver 2% year-on-year growth. The chart below shows we now have as many of the MoM readings (blue bars) coming in below the 0.17% (black line) as above.
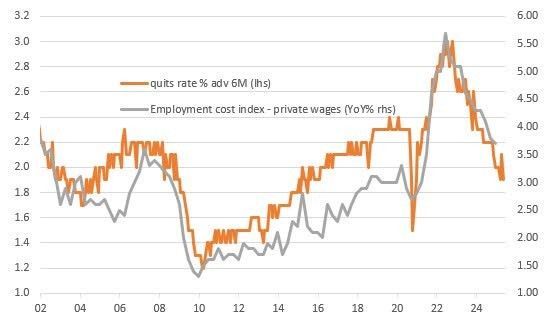
Meanwhile, the employment cost index (ECI) for Q4 2024 was also in line with expectations, rising 0.9% QoQ. This is the best measure of labor market inflation pressures since it includes all earnings and benefits. The chart below shows how those pressures have been rapidly cooling in the private sector. The chart also highlights how the quits rate leads the ECI. The quits rate comes out Tuesday.
Initial jobless claims were 207,000 in the week ending 25 January. Jobless claims fell 16,000 from the previous week's figure. The latest reading was better than the 224,000 forecast. The initial jobless claims is a leading indicator for the jobs market. The next jobs report comes out on Friday 7 February. The consensus estimate is for 175,000 new jobs in January, down from 256,000 in December.
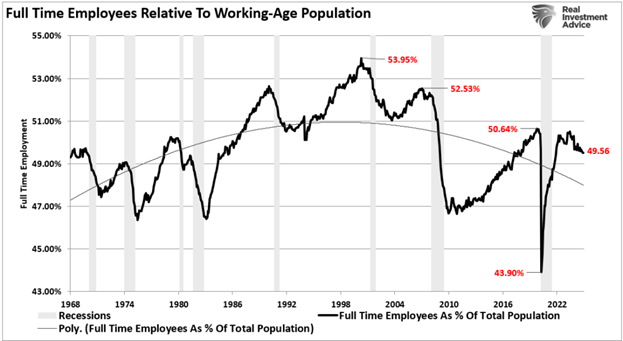
Full-time employment has been falling
Pending home sales took a hit in December.
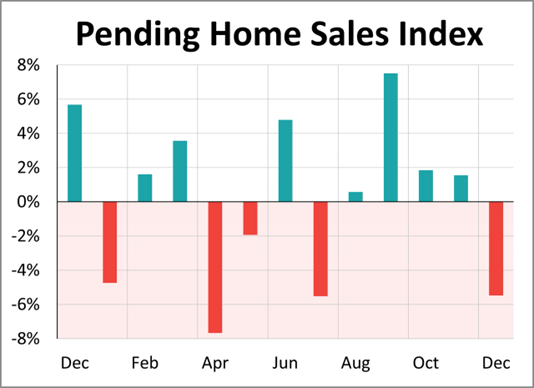
The National Association of Realtors® (NAR) fell 5.5% in December to 74.2, the first monthly decline since July. Pending home sales were expected to be unchanged from the previous month. The index is down 5.0% from one year ago.
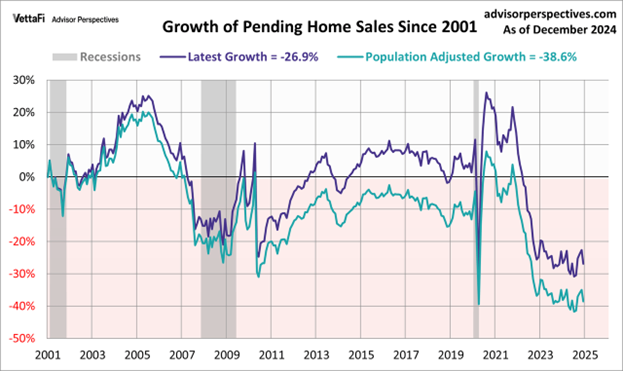
The above chart shows the percentage of turn-of-the-century values. The index for the most recent month is currently 42% below its all-time high from August 2020. The population-adjusted index is 49% off its high from April 2005, near the peak of the housing bubble. The housing market continues to struggle. The pending home sales numbers are in recession territory (gray bars above).
Overall though the U.S. economy continues to grow above trend. There are few signs of a recession in the data. There is also no justification for more Federal Reserve rate cuts.
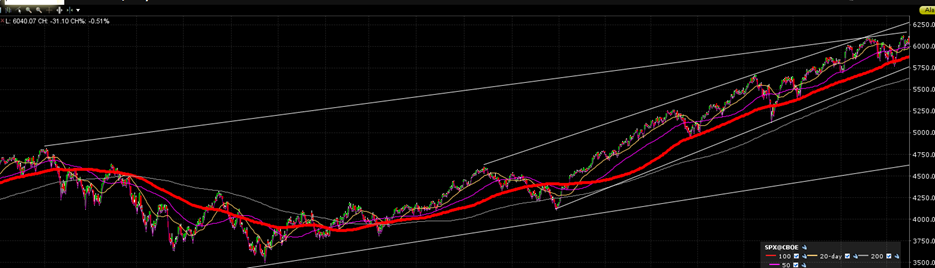
The stock market continues to trend higher.
S&P 500 10-year Chart
It isn’t likely to continue to rise as fast over the next decade though. Investor expectations are almost certainly too optimistic.
Stock market returns have run well above the long-term average over the last 15 years. The long-run average real return is around 8%, according to Aswath Damodaran, NYU Stern School of Business. Stocks have returned roughly 6% from capital appreciation and 4% from dividends on a nominal basis over the last 125 years. Inflation has averaged approximately 2.5% over the same period so real returns have been roughly 7.5% per annum, according to Damodaran.
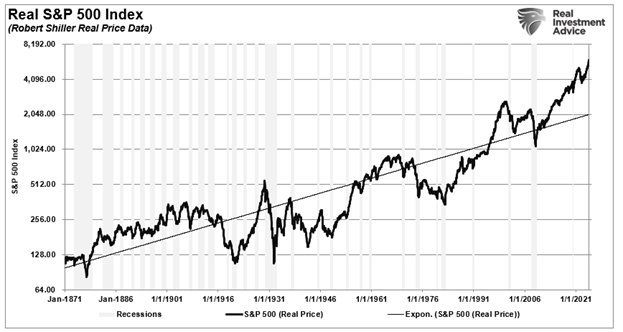
The S&P 500 has risen well above its long-term trend line over the last 15 years.
The chart below shows the average annual inflation-adjusted total returns (dividends included) since 1948. (Data courtesy of Aswath Damodaran, NYU Stern School of Business). The chart shows that from 1948 to 2024, the market returned 9.26% after inflation. But inflation-adjusted total returns jumped after the 2008 financial crisis. The rate of return has been almost 3% higher over the last three observation periods (the post Great Recession years).
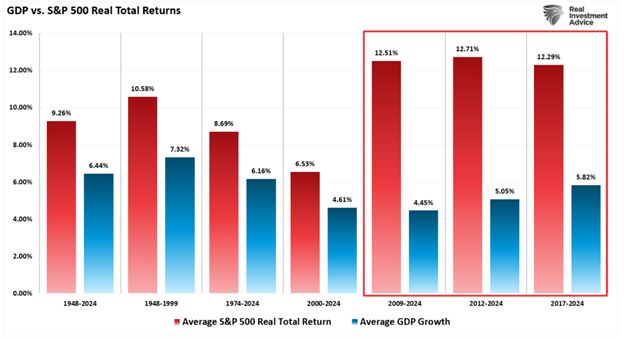
There is a clear relationship between the stock market and the economy. Economic activity creates corporate revenues and earnings after all. Because of the relationship between economic growth and corporate earnings, it isn’t possible for stocks to grow faster than the economy forever.
Why have stocks outpaced the economy by so much since the Great Recession? Since 2007, the Federal Reserve and the Government have injected roughly $40 trillion in liquidity into the financial system to support growth.
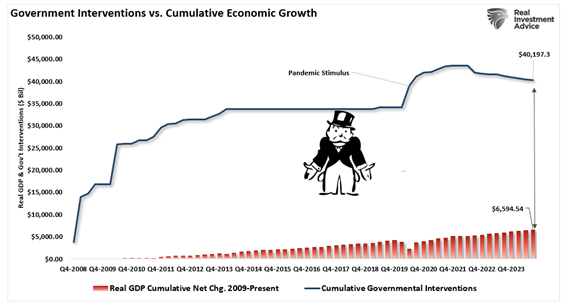
The monetary and fiscal support provided liquidity for the financial system. Asset prices rose and consumer confidence rose with them. The hope was that economic growth would follow. The chart above highlights the large gap between real GDP cumulative net change and the government’s various interventions.
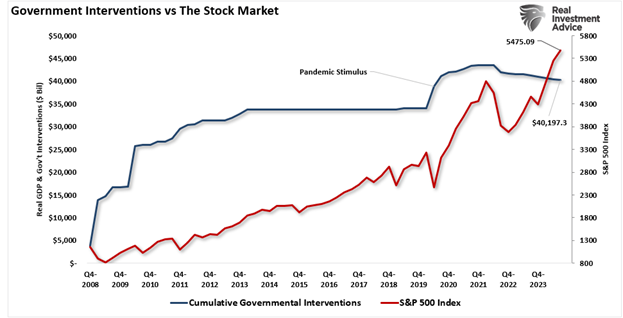
The chart below shows how the stock market has responded to all the liquidity forced into the financial system. It also shows that stocks are continuing to climb higher despite the Federal Reserve reversing course. The Fed has been reducing its balance sheet for over two years now (see chart below). Fiscal spending has taken up the slack so far. The huge deficit spending can't last though. Investors are hoping the Federal Reserve will reverse course. They are hoping the Fed will continue to cut rates and turn the monetary spigot back on. Either that or they are unaware of the impact massive amounts of government stimulus have had on asset prices.
Taken all together, it is likely stock market returns will not match the last decade’s. It is more likely that returns will lag expectations in the coming decade. Investors should pencil in a lower return for financial planning purposes.
Momentum and Overbought Investments (courtesy of BofA)
Gold continues to be the most overbought asset around the globe. It is up 9.1% from its 200-day moving average in U.S. dollar terms, according to BofA Securities data.
Here are a few more of the most overbought global assets, according to BofA:
- U.S. equities – Up 7.8% from its 200-day moving average
- U.S. dollar – Up 3.1% from its 200-day moving average
- High Yield bonds – Up 2.7% from its 200-day moving average
More Interesting Charts:
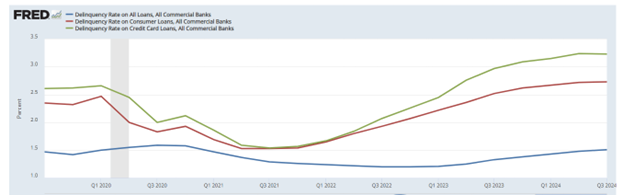
Consumer Delinquencies Rising
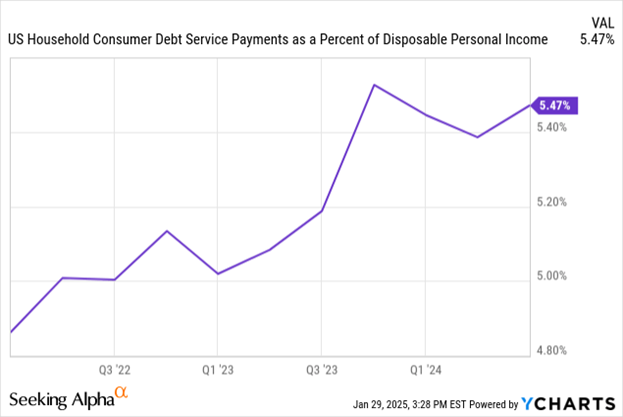
Consumer Debt Service Payments Rising
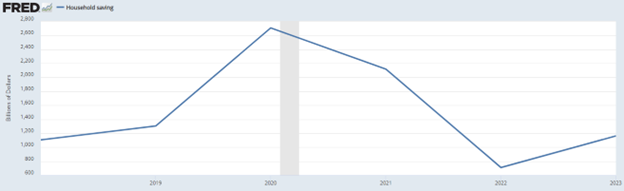
Household savings low but rising
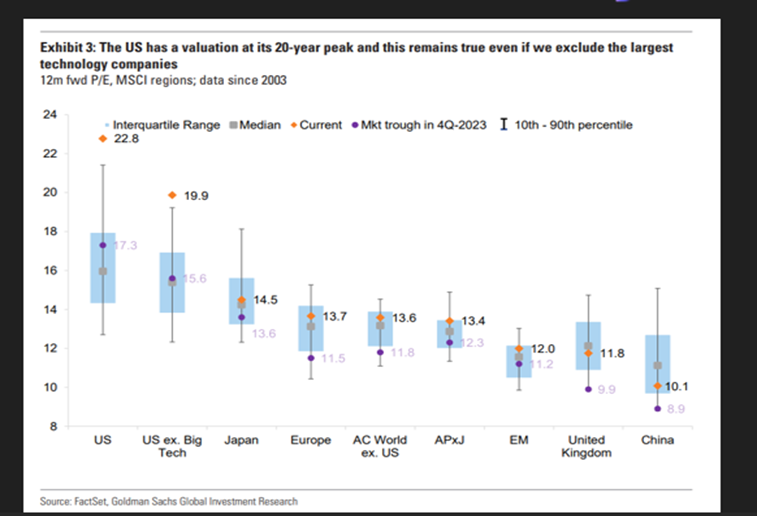
The U.S. market is expensive even excluding big tech stocks
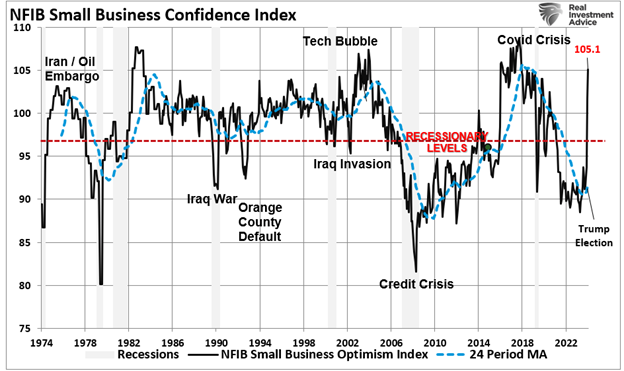
Small business confidence has rebounded.
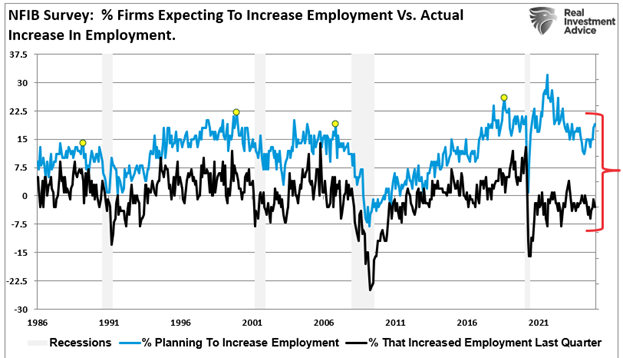
Hiring expectations are high compared to actual hiring
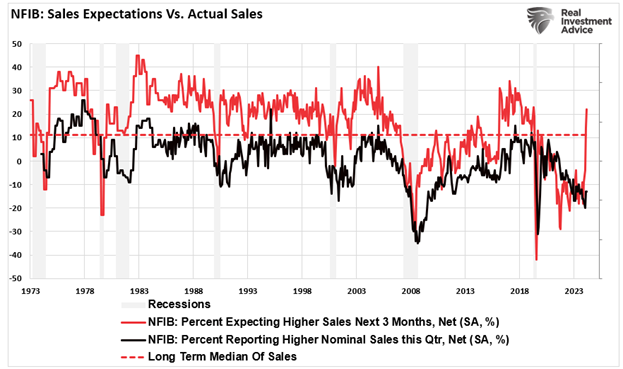
Sales expectations have risen sharply but will sales follow?
Regards,
Christopher R Norwood, CFA
Chief Market Strategist