Executive Summary
- The S&P hit a new high on Thursday, reaching 6,128.18.
- The Volatility Index (VIX) fell to a low of 14.85
- The VIX has declined sharply from 27.6
- The 5.4% decline from 6 December to 13 January doesn’t qualify as a correction
- Watch Earnings, Inflation, and Interest Rates for the stock market's near-term direction
- Don't miss the Charts Worth Seeing at the bottom

The Stock Market
In last week’s newsletter, we wrote, “Last week’s trading felt like a relief rally. Gap-up openings with little follow-through are a classic sign of a contra-trend. We can expect selling in the coming week if last week was a relief rally.”
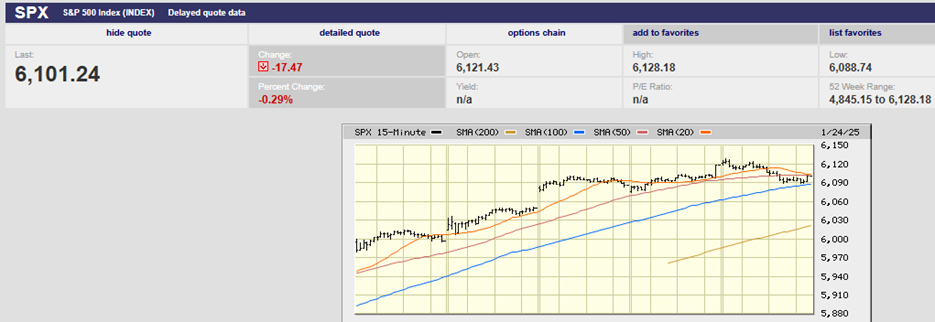
S&P 500 5-day chart
There wasn’t any selling after all last week, at least not until a small down day on Friday. Instead, the S&P moved steadily higher in the first three trading days of the holiday-shortened week. The index hit a record high on Thursday, reaching 6,128.18. Friday saw the S&P pull back 0.29% to close the week at 6,101.24.
On Dec. 18, the day the Fed hinted at the possible end of rate cuts, the VIX surged to 27.6 from 15.9. By Jan. 24, it had fallen to 14.85. That’s a large and rapid decline for the volatility index. Also, 14.85 is a low number. A low VIX is associated with a bull market, one that advances day after day with few pullbacks, little volatility. Investors are signaling a continued advance with little fear of volatility.
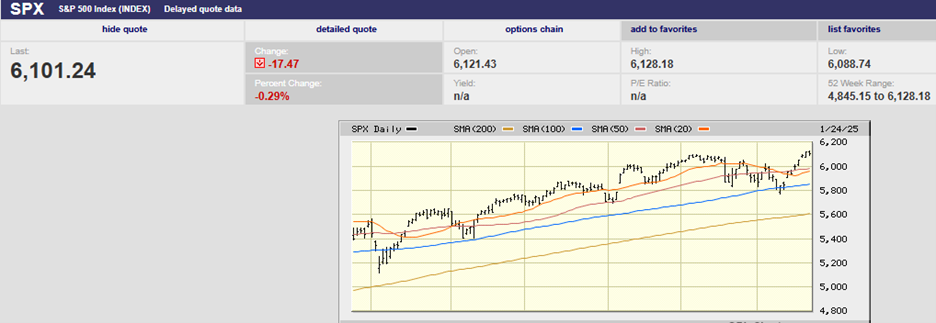
S&P 500 6-month chart
The entire pullback from the 6,099.97 high set on 6 December and ending on 13 January was a mere 5.4%. The low came on 13 January at 5,773.31. Such a small decline doesn’t qualify as a correction. One is still out there somewhere, but probably not soon. The new high hit Thursday is bullish for the stock market in the near term. There is an old saying on Wall Street that new highs beget new highs. It is a nod to momentum investing.
The swing in mood from optimism to bearishness and back was abrupt. SentimenTrader’s Jason Goepfert noted as much recently. He pointed out that bullish respondents in the AAII survey had plunged below 40% for the week ended Jan. 15. It was only the second time that bullish respondents had fallen below 40% since May 2023. One of the few consensus views about 2025 is that volatility will pick up. A strong consensus makes that view suspect. The VIX isn't supporting the consensus view either, at least not yet.
Norwood Economics wrote last week that the S&P might enter a trading range for the next few months. It still might, despite the new high on Thursday. Much will depend on how the earnings season plays out. It’s off to a good start. Companies are beating estimates by an average of 8.7% so far, according to Barron’s. But the bar is high. Q4 earnings growth is expected to be around 9.1%. Earnings growth in 2025 is forecast to be 12.3%.
The near-term direction will also depend on the inflation numbers. The Personal Consumption Expenditure (PCE) index report is next up. It comes out on Friday. Inflation has not been behaving, the most recent CPI report included.
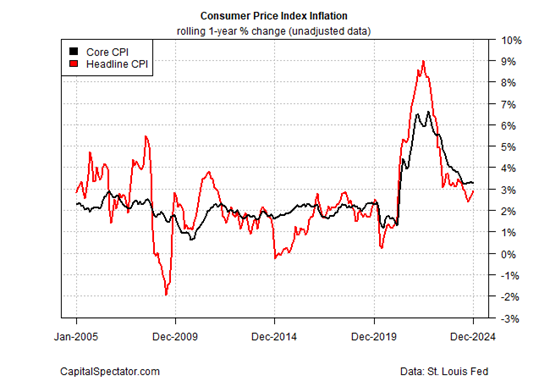
We wrote last week, “ING Financial had this to say about the CPI report, “The US CPI number was better than expected, but it was not a good report.” The CPI accelerated to 0.4% for December from 0.3% in November. Core CPI did fall to 3.2% year-over-year in December. Core CPI year-over-year had held at 3.3% in the prior three months. The latest core CPI number was actually 3.248%. Another two one-thousandths and the core CPI would have been rounded to 3.3%, not down to 3.2%. Core CPI beat expectations by an insignificant amount.”
Now comes the PCE report. It is the PCE index that the Fed pays the most attention to. ING Financial had this to say on the 23rd about the PCE report:
“For Treasury bulls, if this number comes in at 0.2% (or better), that would be a clean sweep of core inflation readings turning the corner again, this time in a positive-for-bonds direction. Even though the year-on-year rate would remain troublingly high (2.8%), base effects for the subsequent number of months would ratchet that YoY rate down to the sub-2.5% area.”
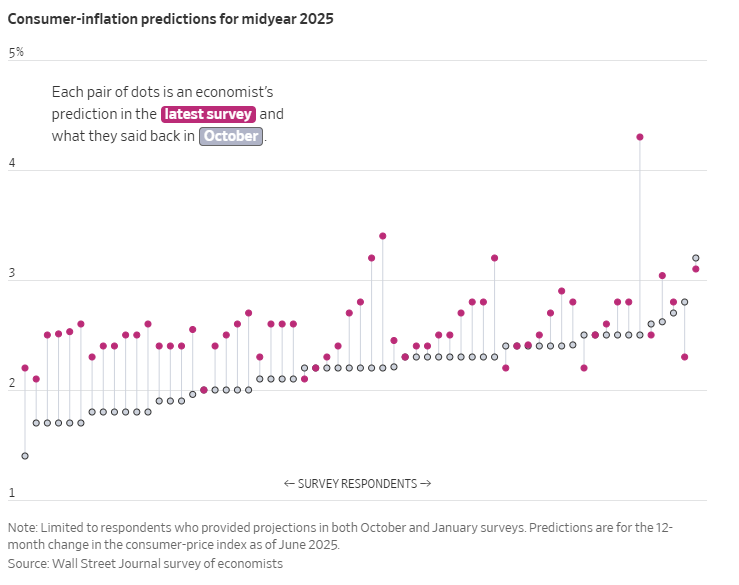
ING might be right about inflation continuing to ease, but not all economists agree. In fact, many economists have recently raised their inflation expectations. That according to a new survey published by The Wall Street Journal. The outlook for the year-over-year change in the CPI over the next 12 months rose to 2.7% in the latest quarterly poll. The average next 12 months estimate had been 2.3%.
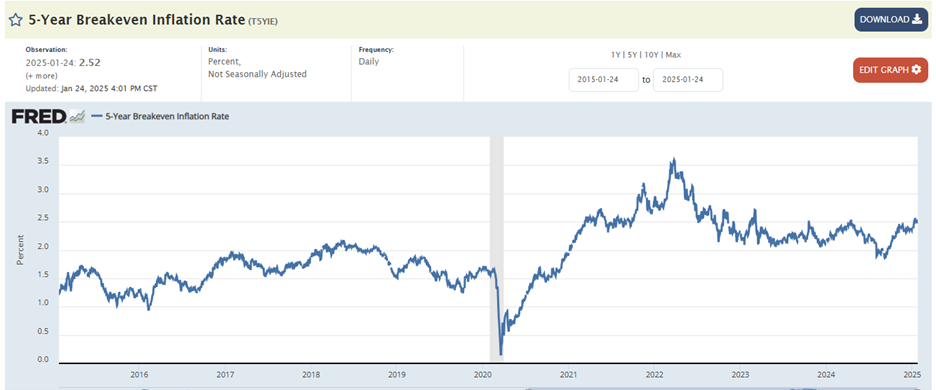
Norwood Economics pointed out last week that break-even expectations were rising as well. The five- and ten-year break-even expectations are inflation estimates by bond investors. The Breakeven Expectations are the expected average inflation rate over the five- and ten-year periods.
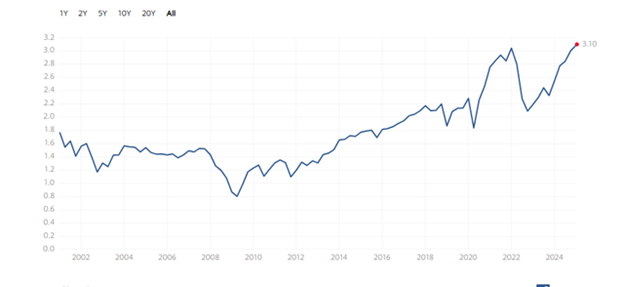
The 10-year Treasury may be signaling higher inflation to come as well.
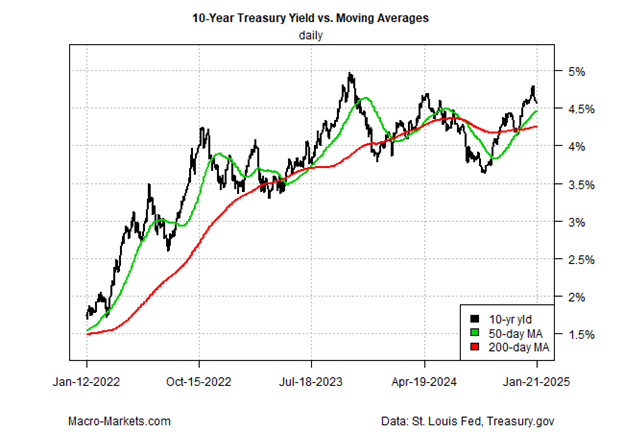
The 50-day moving average has moved above the rising 200-day MA (chart above). The 200-day ma is the main trend. The 50-day crossing indicates near-term upside as well.
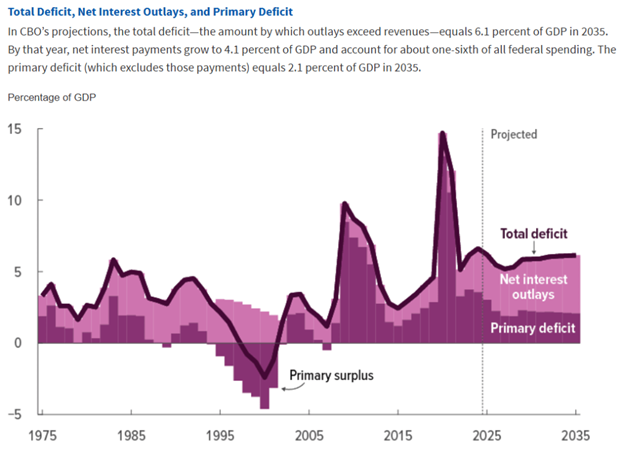
It’s also possible that longer-term yields are rising because of the large and growing deficits. By 2035, the Congressional Budget Office (CBO) projects that the adjusted deficit will be 6.1% of GDP. That's well above the 3.8% average of the past 50 years.
The CBO projects the deficit to total 6.2% of GDP in 2025, shrink to 5.2% by 2027, then climb again to 6.1% by 2033. “Since the Great Depression, deficits have exceeded that level only during and shortly after World War II, the 2007-09 financial crisis, and the coronavirus pandemic,” the CBO said. The CBO’s outlook embodies optimistic assumptions. It assumes no recessions in the coming decade. It's based on current law, including the expiration of the Tax Cuts and Jobs Act of 2017. Renewal of the tax law would add another $4 trillion to the debt over the next decade.
Large borrowing needs by the government increase the supply of debt. More supply means upward pressure on yields. Buyers are only willing to buy so much after all. Prices must fall if governments want to sell more bonds. Michael Hartnett, chief investment strategist at BofA Global Research, sees rising bond yields as the No. 1 long-term risk faced by investors.
Strong earnings, lingering inflation, and higher-than-expected interest rates. Three factors that might offset, leading to a trading range market in the coming months. A solid earnings season creates a tailwind for stocks. Lingering inflation and higher-than-anticipated interest rates create a headwind. A standoff ensues. It is a reasonable expectation. We'll see as 2025 unfolds.
Charts Worth Seeing
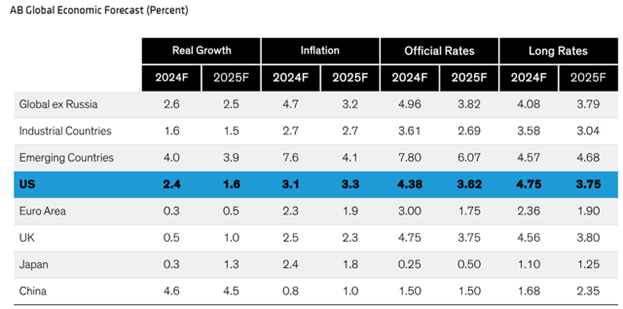
Long rates falling to 3.75% (chart above) in 2025 is a stretch. U.S. GDP growth may well end up closer to 2.0% - 2.5% as well.
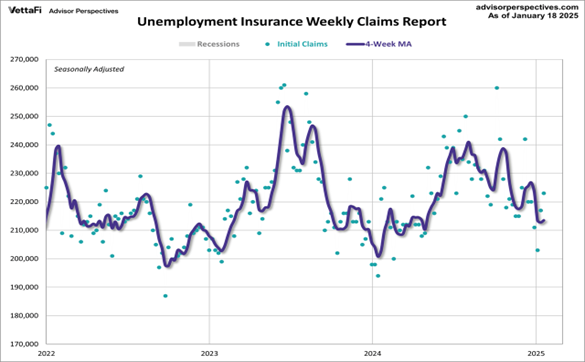
Initial jobless claims are still signaling a strong labor market.
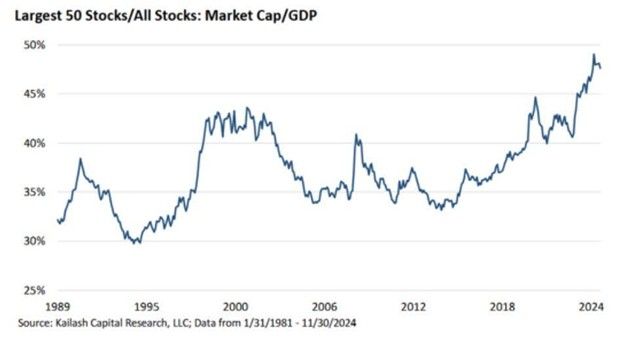
The stock market is concentrated with the largest 50 stocks by market cap making up almost 50%.
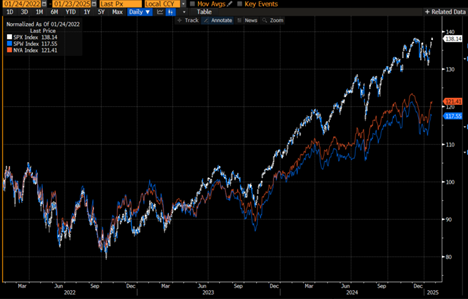
The market cap-weighted S&P has outperformed the equal-weight S&P and the New York Stock Exchange since the fall of 2023.
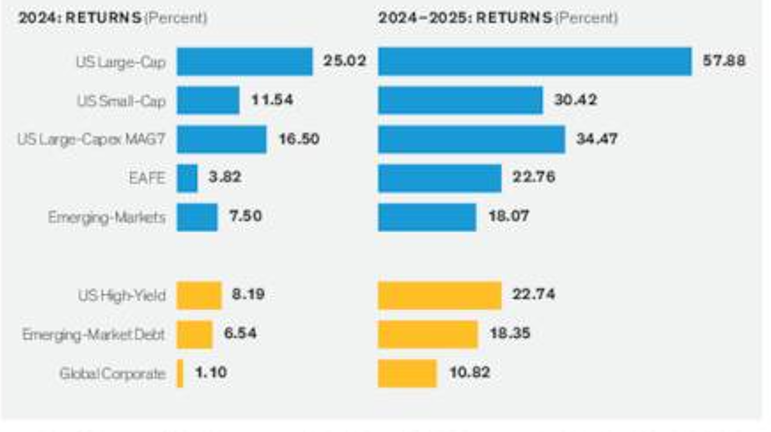
The chart above is mislabeled. The author meant 2023-2024 returns. U.S. large-cap stocks ruled during the last two-years.
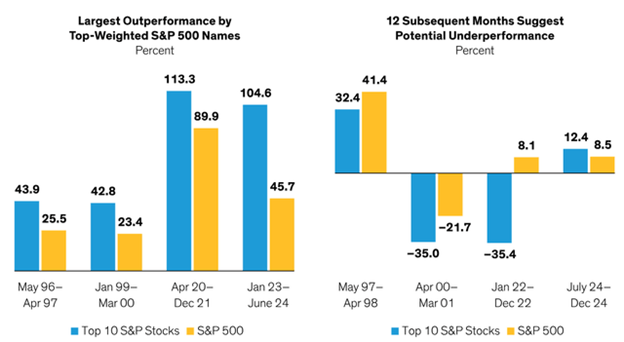
Prior periods of outperformance by the largest stocks are often followed by underperformance.

The stock market is expensive using Warren Buffet’s favorite measure.
It’s also expensive based on price-to-equity (P/B)
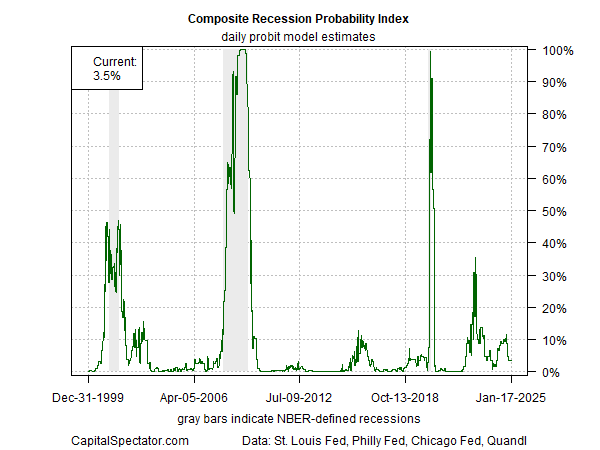
The odds of a recession have been falling.
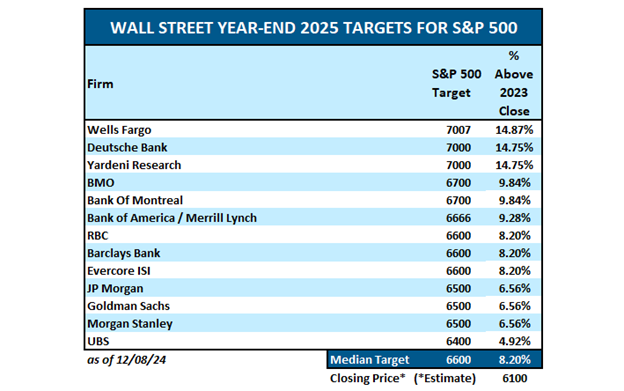
Wall Street is bullish with price targets ranging as high as 7,007 for 2025.
Regards,
Christopher R Norwood, CFA
Chief Market Strategist