

The rise of the S&P.
Small business pessimism.
Creating a successful retirement.
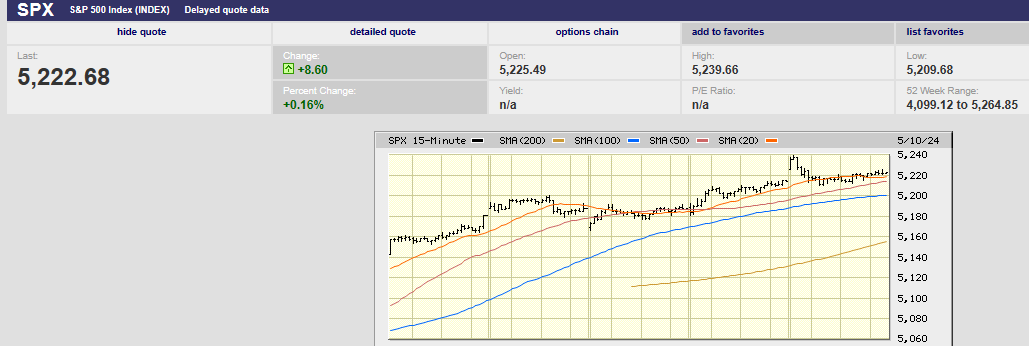
5-day S&P 500
Market Update
The S&P 500 rose 1.9% last week to finish at 5,222.68. The market moved steadily higher throughout the week. The Nasdaq rose 1.5%. The 10-year Treasury yield finished at 4.51%. The two-year yield finished Friday at 4.90%. The S&P is up 27.3% since it bottomed on October 27th, 2023. It is up 49.6% since the low on 13 October 2022. The advance is largely due to multiple expansion, not earnings growth. The S&P was trading around 16x 12-month forward earnings in October 2022. It is trading at around 20.5x 12-month forward earnings today. The long-run average is around 16x 12-month forward earnings. The S&P would need to fall to around 4,100 to return to the average price-to-earnings multiple.
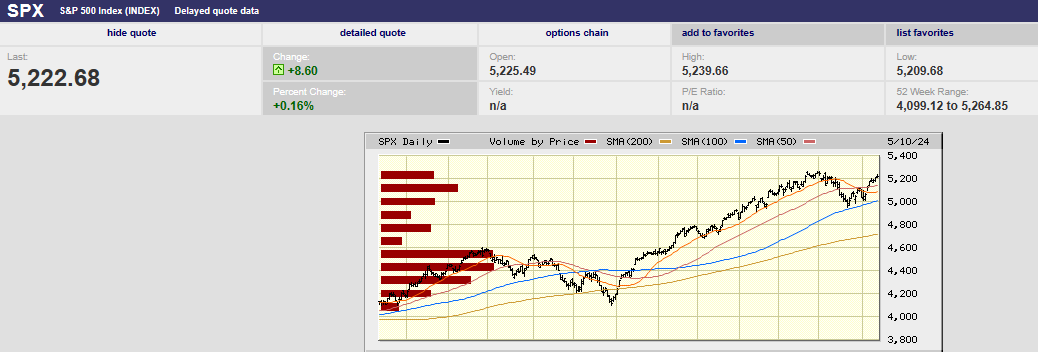
1-year S&P 500
The S&P didn’t rise because of rising earnings estimates either. Earnings and sales growth estimates for 2024 have remained the same since 2022. Earnings for 2024 are expected to be $243.7. That estimate hasn’t changed much since December 2022.
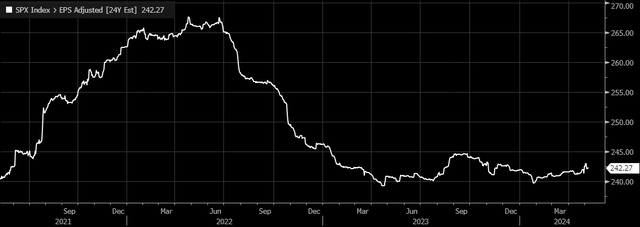
2024 Earnings Estimate
First quarter earnings may have come in better than expected. But first quarter earnings estimates haven’t changed since early 2023.

First Quarter Earnings Estimate
Sales growth estimates haven’t been rising for 2024 either. Estimates have been trending sideways since the middle of 2022.
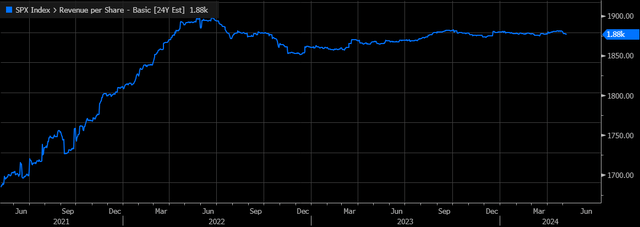
Sales Estimate
All of which means the S&P 500 didn’t rise because of rising sales and earnings forecasts. Rather the stock market has vaulted higher since the fall of 2022 due to the rate cut narrative that is no more. A false narrative brought the S&P 500 to 5,222. What will keep it there or spur it higher?
Not rising earnings growth. In fact, J.P. Morgan global market strategists are calling existing analysts’ forecasts “very optimistic”. Analysts are expecting earnings to rise 17% by the fourth quarter from the first quarter. Projections assume high top-line growth or margin expansion the strategists wrote. They think mid-single-digit growth of around 5% for the rest of the year is more likely.
Strategas strategists think earnings forecasts are optimistic as well. They pointed out in a note to clients that S&P operating earnings historically declined by around 10% in the 12 months after the first-rate cuts. That is because Fed easing is usually associated with economic and market stress.
Norwood Economics writes a quarterly letter to clients. We wrote about the National Federation of Independent Businesses (NFIB) Optimism Index falling to 88.5 in March in last quarter's letter. It is at the lowest level since December 2012. It is the 27th consecutive month below the 50-year average of 98. Small businesses account for around 46% of all private sector jobs. They account for around half the job growth in the U.S. Small businesses are pessimistic about the economy.
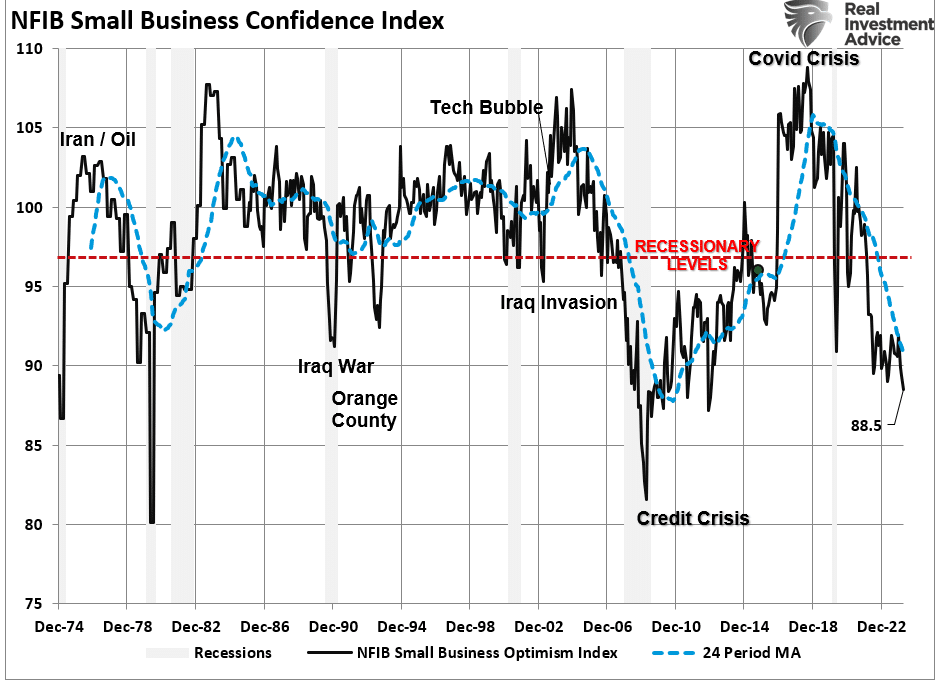
Small Business Confidence Index in Recession Territory
Small business owners aren’t expecting to hire as many employees in the coming months.

NFIB Hiring
Rental delinquency rates signal small businesses are experiencing financial distress.
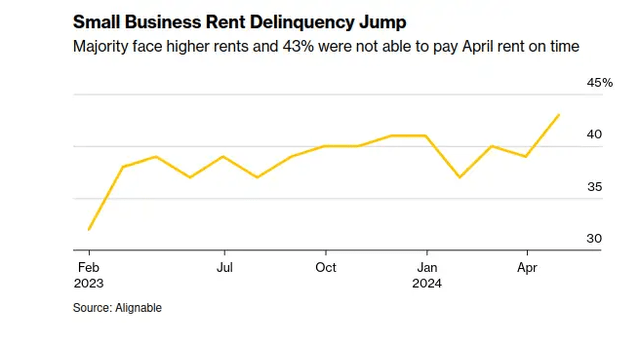
Small businesses wouldn’t be pessimistic about the economy or hiring if demand was strong. The lack of confidence among small business owners means earnings are more likely to disappoint in the coming quarters.
The University of Michigan’s latest sentiment survey is another worrying sign. The May consumer sentiment survey fell to 67.4 from 77.2 in April. The forecast was for 76.0. Current conditions dropped to 66.5 from 76. The consumer sentiment survey is at a level associated with recession going back to 1978.
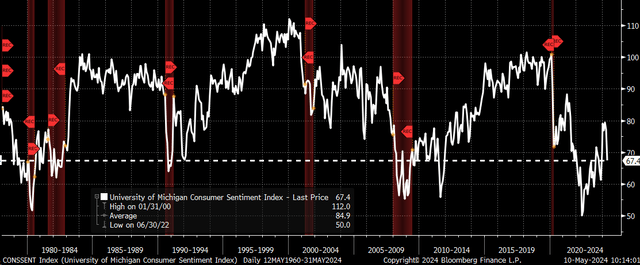
Sentiment Survey in Recession Territory
The current conditions and sentiment decline in May were among the largest drops in the series' history, dating back to 1978. The current conditions index fell by 10.2 points. The sentiment number fell by 9.8 points over the one-month period. Meanwhile, one-year inflation expectations increased to 3.5% from 3.2%. It is the highest level since November 2023. The three-month trend is up. The 3–5-year outlook for inflation expectations is 3.1%. That's up from a 2.8% rate in March. It also puts the data series at the upper boundary since 2022.
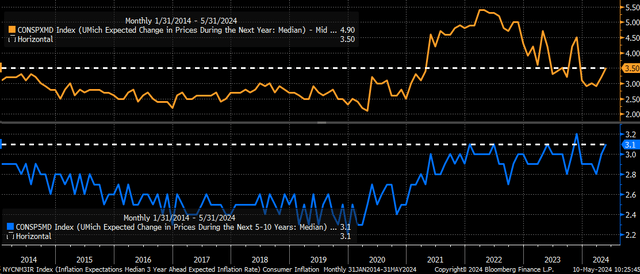
1-year & 5-10-year Inflation Expectations
Rising inflation expectations will make it more difficult for the Fed to cut in 2024. The Atlanta Fed GDPNow tool is reading 4.2% for the second quarter. The reading will likely come down between now and quarter end. Still, expectations of GDP growth above 2% will also make it hard for the Fed to justify rate cuts.
Earnings estimates are at risk. Small business and consumer pessimism and aggressive earnings growth estimates suggest as much. Also, interest rates are likely to stay higher than anticipated at the beginning of the year. The Fed doesn’t have much room to maneuver. Strong GDP growth and inflation expectations make it difficult to justify cutting. The current environment suggests that investment risk is elevated. Risk management remains a priority.
Economic Indicators
It was a light week for economic data. The reports that did come out suggested weakness in the economy. Consumers pulled back on credit card use in March. Total consumer credit increased by $6.3 billion versus a $14.8 billion estimate. The growth rate fell from 3.6% to 1.5%. Consumer sentiment fell sharply as well. The May number was 67.4, down from 77.2. It was well below the 76.0 number expected. Initial jobless claims rose to 231,000 from 209,000 the prior week. It is the highest level in nine months and bears watching.
Leading economic indicators are pointing to a recession. Small business and consumer sentiment are also suggesting recession. Coincident indicators have yet to confirm a recession. The unemployment number is a lagging indicator. The U.S. economy will already be in recession by the time unemployment begins to rise significantly. We wrote in our first quarter client letter that the recession is still out there. It’s a matter of when not if. Norwood Economics is expecting a recession by the end of the year, early 2025 at the latest.
Stock Prices, Returns, and Spending Goals
We do annual 401k education for our retirement plan clients. The presentation includes information about the economy and capital markets. There were several participants who remained after the presentation to ask questions. Many of the questions had to do with the stock market and what it might do for the rest of the year. I told them that a 10% to 15% pullback in the S&P 500 wouldn’t be a surprise. But I also reminded them that predicting short-term stock market returns was difficult at best. I encouraged them to focus on saving enough while investing appropriately. A long-term focus is the key to creating a successful retirement.
That said, I let them know that the U.S. stock market is likely to underperform its long-term average return over the next decade. Not anything for the younger crowd to worry about. Very much something that people approaching retirement should worry about. An investment portfolio that doesn’t achieve its expected return is a problem for those approaching retirement. Spending goals are threatened when return expectations aren't met. Knowing that the U.S. stock market might only earn low single digits over the next decade allows you to act. Specifically, it allows you time to save more to make up for the return shortfall.
Let’s look at the evidence for stock market underperformance over the next decade. We can start by recognizing that the S&P 500 has barely kept up with three-month Treasury bills since January 2022. We may already be in a "lost" decade of investing.
Stocks are expensive. The chart below comes from Dr. John Hussman. It shows nonfinancial market capitalization/Nonfinancial corporate gross-value added. It is a variation of Warren Buffet’s favored measure – market cap to GDP. It is Hussman’s most reliable valuation measure. It has a high correlation with actual subsequent S&P 500 total returns. The current valuation is just shy of those observed in August 1929 and January 2022.
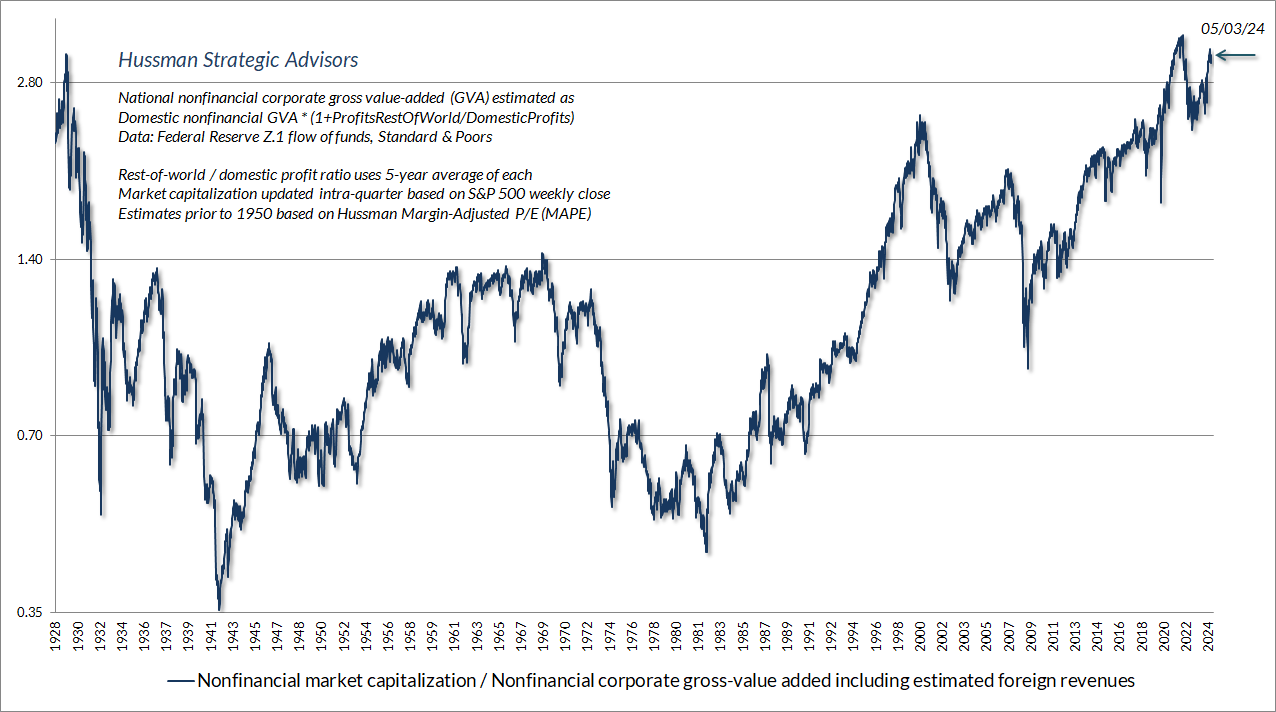
Nonfinancial Market Cap/ Gross Value Added
Actual 12-year total returns above Treasury bonds are highly correlated to estimated 12-year S&P 500 total returns above Treasury bonds using Hussman’s variation of Buffet’s favorite measure. (Not surprisingly market Cap to GDP works well also).
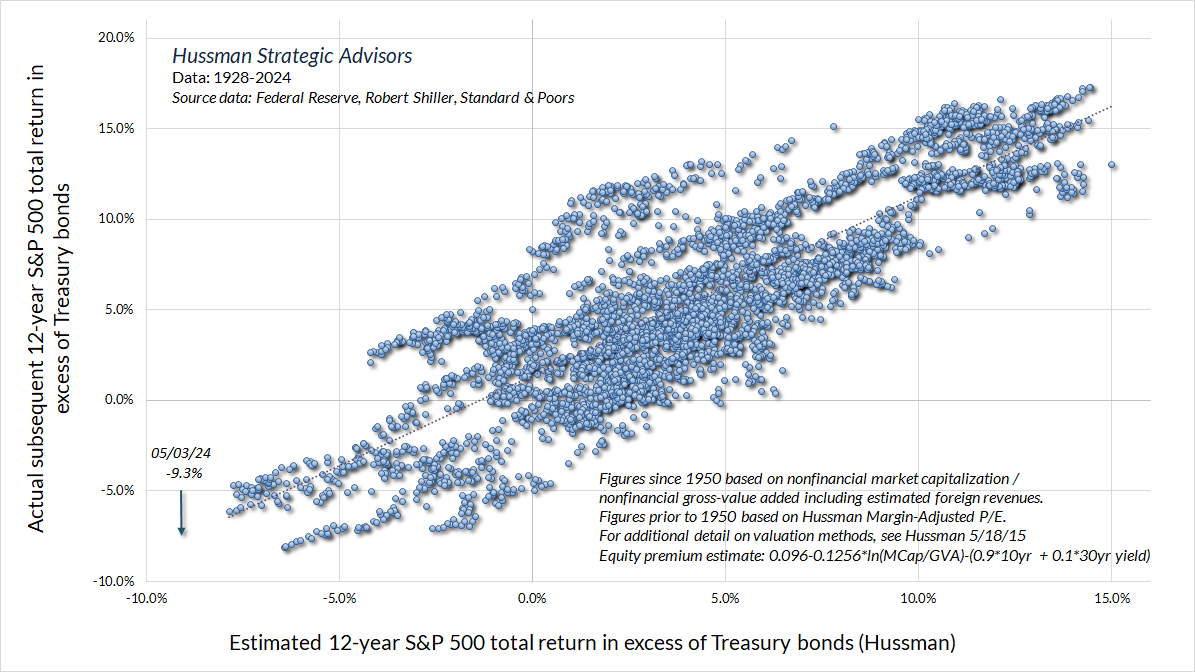
Actual Returns Correlated to Estimated Returns
The chart below is a second way to see how high valuations impact long-term returns. The S&P 500 price/forward earnings ratio is currently around 20x. Data since 1990 predicts low single digit 10-year average annual returns. This is a bullish scenario. It assumes that valuations stay at a new high plateau rather than reverting to the long run average. It also ignores data from before the 1990s and the "Bubble Years".

12-month Forward P/E
Forewarned is forearmed. Investors hoping to have a successful retirement need to save more. Saving more will make up for the below average returns likely to plague them in the coming decade.
Math Nerds: The charts are pictures created with math. The math is straightforward. Nonfinancial corporate revenues and nominal GDP have grown an average of 4.5% over the past 10, 20, and 30 years. The S&P 500 dividend yield is 1.4%. Prices will grow at the same rate as fundamentals if valuations remain at the current high level. The S&P 500 will return 5.9% in that case since 4.5% plus 1.4% equals 5.9%. The estimated 10-year total return falls to -0.5% annually if valuations return to 2020 levels. The estimated 10-year total return falls to -5.8% annually if valuations retreat to the long-term average.
A low single digit return for the S&P is a bullish scenario for the coming decade. We need only look to the zero return years of 2000 to 2013 for proof long-term underperformance can happen. As John Wooden, the Hall of Fame basketball coach and Indiana native, often said, “Failing to prepare is preparing to fail.”
Regards,
Christopher R Norwood, CFA
Chief Market Strategist


