

- Investors bought the CPI Report.
- Consumers running out of gas.
- Inflation still a problem.

Market Update
The S&P 500 closed the week at 5,303.27, up 1.5%. The 10-year Treasury ended the week yielding 4.43%. The two-year ended the week yielding 4.85%. The two-year Treasury most closely tracks the Fed funds rate. It continues to signal a lower fed funds rate by year-end.

Wednesday’s Consumer Price Index (CPI) report encouraged stock investors. The S&P was up 1.2% on the day in reaction to the report. The stock market reacted positively to the headline and core CPI numbers. Yet the Federal Reserve focuses on the Personal Consumption Expenditure (PCE) number, not the CPI. The next PCE report is out on 31 May.
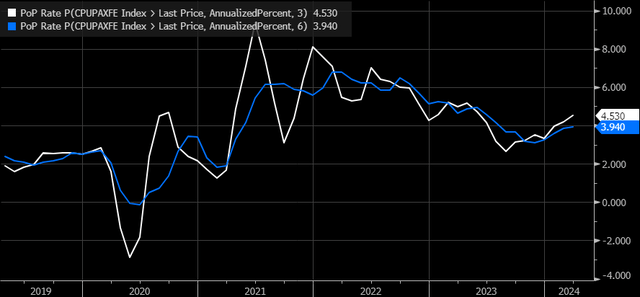
The stock market moved higher on Wednesday even though the core CPI number came in as expected. Core was up 0.3% in April. It is up 3.6% year-over-year. Inflation in the services sector continues to be sticky. Service sector inflation rose by 0.4% on a monthly basis. Core Services inflation excluding shelter is 5.2% on a year-over-year basis. Core services excluding shelter is the main contributor to price increases remaining elevated. It won't help the yearly number that the two lowest monthly service numbers roll off in the next two months. Regardless, core services inflation over 5% is inconsistent with the Fed’s 2% goal.
(Supercore inflation is a measure which excludes all goods prices, food and energy prices, and housing costs. This measure represents about a quarter of the CPI measure and about half of the PCE deflator.)
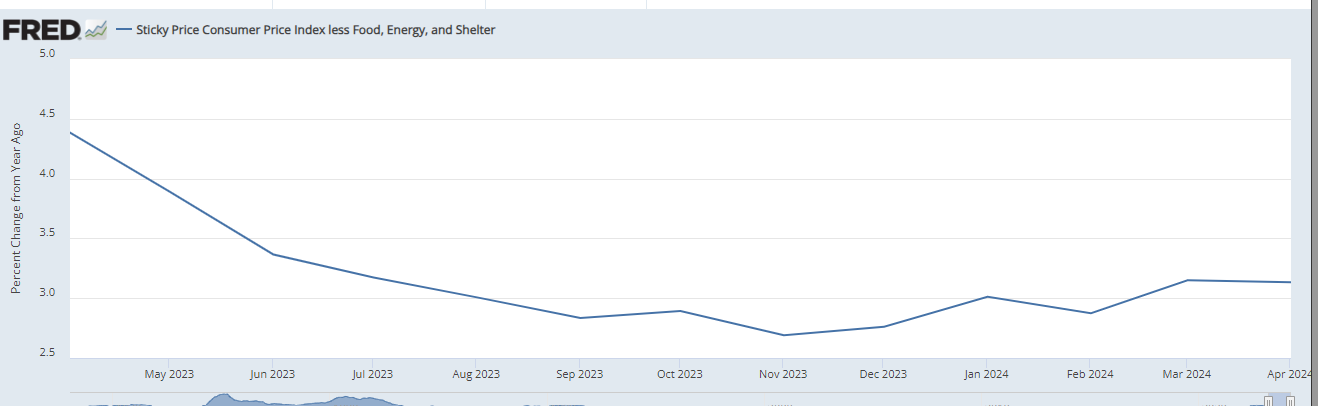
Sticky Price CPI has risen since last fall
The Fed focuses on the PCE numbers. Core CPI came in as expected. Yet stock investors bought the market in response to the CPI report. A Bloomberg commentator said Wednesday that investors bought the news because they wanted to buy. Investors bought because risk-on is the trade this week, she said. She didn’t think investors were reacting to a good CPI report because it wasn’t that good. Animal spirits in other words. She’s probably right.
Investors want to own stocks, the main trend is up and investors don’t want to be left behind. They are looking for any excuse to jump on the bandwagon. Momentum is a thing and right now momentum is an investor’s friend. There is no supply above to generate selling pressure. (Investors waiting to sell a losing position as the market gets back close to breakeven). Stocks and stock markets hitting new 52-week highs is bullish. The 20-day moving average is about to rise back above the 50-day moving average, a positive for the algorithms. The S&P has a clear path higher through year end… unless fundamentals deteriorate noticeably. We’re referring to economic growth, earnings growth, and inflation.

5-year S&P 500
And there are signs of trouble with all three. We’ve written recently about small business stress. We’ve written about poor consumer sentiment. Now there is evidence the consumer is beginning to run out of spending power. The New York Fed’s Quarterly Report on Household Debt and Credit was released Tuesday. It shows debt levels and delinquency rates continuing to rise. More people are missing payments on credit cards and auto loans. Also, the University of Michigan’s latest sentiment survey showed a sharp 13% drop in consumer sentiment for May.
We wrote last week about unrealistic earnings expectations. (See From the Bleachers, Vol. 278). Economic growth is in question too. The Conference Board's Leading Economic Indicators Index (LEI) printed a negative 0.6% last week for April. The Conference Board reported that consumers’ outlook on business conditions deteriorated. As well there were weaker new orders, a negative yield spread, and a drop in new building permits. Stock prices were negative also.
The LEI’s six-month and annual growth rates no longer signal recession, according to the Conference Board. But they still point to “serious headwinds to growth ahead”. The Conference Board went on to say that elevated inflation, high interest rates, rising household debt, and depleted pandemic savings are all expected to weigh on the U.S. economy in 2024. The Conference Board is forecasting a slowdown to under 1% over the Q2 to Q3 2024 period.
The Empire State Manufacturing Survey's headline number came in at -15.6 last week. It was weaker than expected. The indicator has been weaker than expected three months in a row. The headline number indicates a contraction in the Northeast’s manufacturing economy. One of the weakest areas of the report has been New Orders. The January report saw New Orders fall to one of the weakest readings on record. New Orders have recovered a bit but remain in only the 6th percentile of all months. It is the eighth month in a row with a contractionary reading in New Orders. It is one month away from tying the record of nine months in a row set in 2008/2009 and again in 2015/2016.
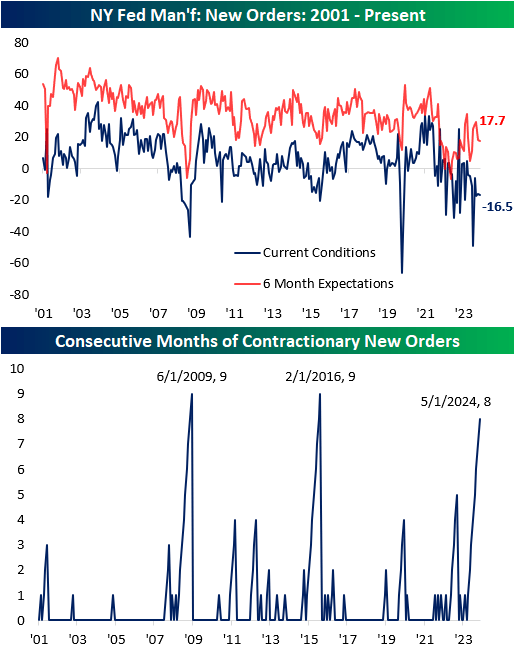
One area that is just as bad is spending plans. The indices for number of employees, capital expenditures, and tech spending are historically low. The region’s manufacturers have some of the most pessimistic spending plans for labor or capital in the survey’s history.

We also wrote last week about rising inflation expectations in the University of Michigan survey. Inflation expectations are important because they become self-fulfilling prophecies. Workers expecting inflation are more aggressive about asking for pay hikes. Businesses expecting inflation are more likely to raise prices to recoup rising input costs.
There are other reasons to believe that inflation will remain higher than desired. The Federal Reserve relies on backward looking data to make monetary policy. The data isn’t particularly accurate either, at least not until after revisions. There are forward-looking inflation indicators that are more useful though. Money supply relative to GDP is one such indicator. Too much money chasing too few goods is the classic definition of inflation. There is still lots of money sloshing around in the financial system. Excess money leads to higher inflation.

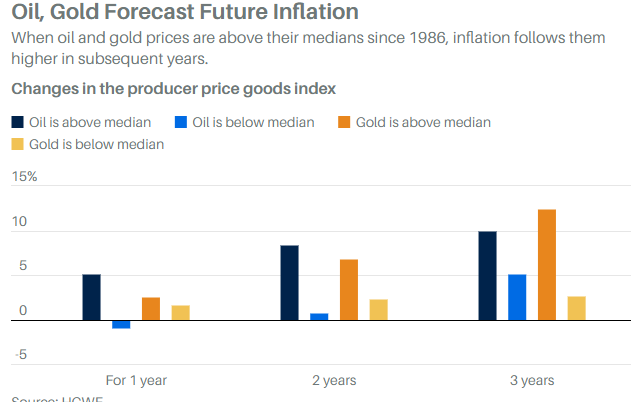
Gold and oil have a solid track record predicting inflation, according to Dr. David Ranson. His model looks at annual prices for oil and gold relative to their median. He finds that the producer price index (PPI) posts significant increases after periods in which oil and gold are above their median annual price. The PPI for goods was up an average of 7.3% in the 27 years in which both gold and oil posted year-over-year increases going back to 1949. Producer prices are a leading indicator of consumer prices. Ranson finds that consumer prices rise faster when producer prices are rising, according to Barron's. He also finds that producer prices rise faster when oil and gold are above their median annual price, as they are now.
On Friday, May Comex gold settled at a record $2412.20 an ounce, up 32.8% from October. WTI crude, meanwhile, trades around $80 a barrel, up from around $70 a year ago. Movements in gold and oil prices mean that, “the inflation outlook in the coming year is for a large increase,” Ranson wrote to clients. Then there is copper. Copper is well known as a leading economic indicator. Copper's price action is pointing to stronger economic growth. All else equal stronger economic growth means higher inflation. Ranson’s model, copper, and the stock market itself are all arguing against Fed rate cuts. Yet the Fed seems determined to cut rates this year. Higher inflation is the likely outcome if it does.
Uncertainty remains unusually high. Risk management remains the priority.
Retirement Planning
No plan isn’t a plan. I was with a 401k plan participant last week helping him gain access to his 401k account. He repeatedly told me he was done working in seven years. I finally asked why seven years. His response was that he’d be 65 in seven years and deserved to be done working. The full retirement age for social security is 67. Retiring and taking social security early means a reduced benefit. I asked him if he had other investment assets besides his 401k account. He didn’t. Nor did he have much in his 401k account, only $35,000. His wife had liquidated and spent her 401k money when she changed jobs less than a year ago. Currently, neither of them is saving for retirement. He was planning on starting to defer into his 401k account. Whether he follows through or not remains to be seen.
There is no hope that he will be able to retire in seven years unless his wife continues to work full-time. Social security is only designed to replace 40% of pre-retirement income. And he won’t be receiving the full benefit if he starts taking it two years early. It will be tight even with social security and a working wife. His determination to retire in seven years because, in his words, “he deserved it” will run smack into reality. And it won’t take long.
Sadly, this gentleman isn’t alone. In fact, his attitude and financial situation is common. Planning for the future is necessary if you hope to have a retirement. Most Americans are expected to need some wages in retirement to make ends meet. That means working at least part-time. A surprising number of high-income earners are in the same boat. They made more during their careers but spent it as well.
Financial planning should be done early enough to impact your retirement. Beginning to plan in your 20s and 30s isn’t too soon.
Creating a financial plan a year before you plan to retire doesn’t give you enough time to significantly improve your situation. Get started now so you can have a better tomorrow.
Regards,
Christopher R Norwood, CFA
Chief Market Strategist


