

- Short-term negative technical signals
- Economic news gives no reason to cut
- Recession signals lurking
5-day S&P 500
Market Update
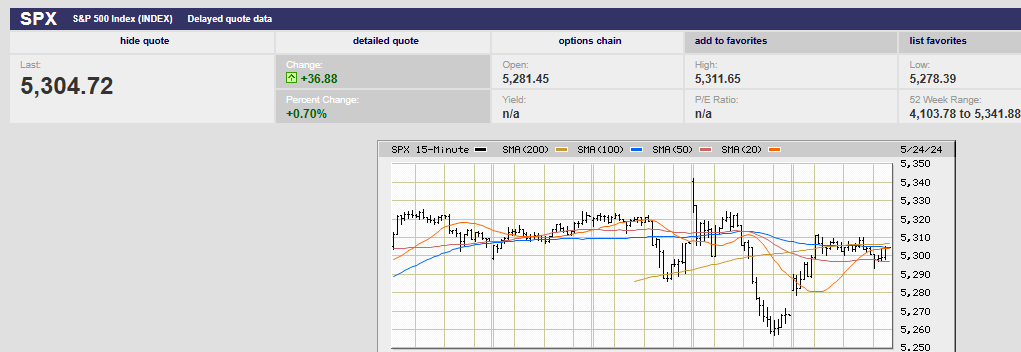
The S&P 500 rose 0.03% on the week to finish at 5,304.72. The DOW industrials fell 2.33% on the week. The Nasdaq Composite rose 1.41%. The 10-year Treasury yield ended the week at 4.46%. The 2-year Treasury yield ended the week at 4.95%.
It was a flat market for much of the week. Thursday was the exception. Selling knocked the S&P down 0.7% Thursday, possibly due to the strong economic news. The day began at 9:30 with a gap-up open. The S&P flash U.S. PMI reports were released at 9:45. The selling started around 11.
Investors selling an up open is a short-term negative signal. That the S&P went on to have an outside down day is a stronger short-term negative signal. An outside down day occurs when the market hits a higher high than the prior day but closes below the prior day’s low. It’s considered a short-term negative signal because of the reversal. Investors who sell a rally are anxious to lock in profits. It means they are nervous about the market. Nervousness increases the likelihood of more selling to come.
Friday was an inside day. An inside day occurs when the day's trading remains within the prior day's range. The high is lower and the low is higher than the prior day. An inside day is a consolidation day. The lack of follow through selling on Friday muddles Thursday's message. (Technical analysis is far from a science).
Market internals were weak on Thursday as well. Only 10 of the 65 technology stocks in the S&P 500 rose, according to Jeff deGraaf, chairman and head of technical research at Renaissance Macro Research. Also, more than 70% of NYSE volume was in declining stocks. The outside down day and weak market internals Thursday suggests a period of consolidation. The odds favor a down week this week, or perhaps more sideways trading.
The stronger-than-expected economic news Thursday likely explains why the CME FedWatch tool is now forecasting a single rate cut in 2024. A second cut isn’t expected until the Fed’s January policy meeting. Futures traders had been looking for a second cut in mid-December. The stock market still doesn’t seem to be pricing in higher for longer interest rates. That despite expectations of six rate cuts this year falling to just one.
Market strategists aren’t expecting much from the S&P 500 between now and year-end either. The median year-end target among strategists for the S&P 500 is 5400, according to Morningstar. That is just 1.8% above Friday’s close of 5304.72. Not much reward for the risk of owning stocks. Investors can opt for six-month T-bills and match the strategists’ median target. And that's even after taking the S&P 500’s dividend yield into account.
The main problem for the stock market is valuation. The S&P is trading at 21.7x 2024 earnings. The long run multiple is 16x. Fixed income represents a good alternative to an expensive stock market. Earnings growth estimates are aggressively bullish and likely to disappoint. The consensus is for earnings growth of 9.6%, 14.1%, and 12.5% for 2024, 2025, and 2026. All in all the setup isn’t great for the stock market into year end.
The below table is courtesy of Barron’s:
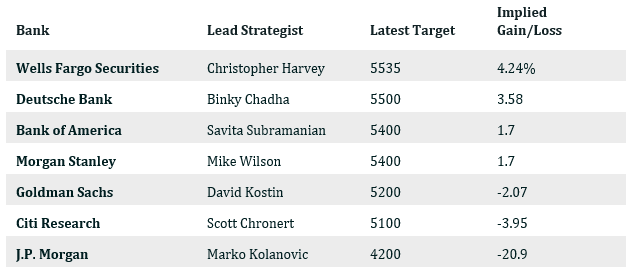
Note: All targets are for year-end 2024 except Morgan Stanley which is 12-months forward.
J.P. Morgan’s Marko Kolanovic stands out for his bearishness. He says he doesn’t see stocks as “attractive investments”, according to Barron's. He’s expecting the S&P 500 to drop to 4200 by December. He cites restrictive rates, inflation, and stress on lower-income consumers as negatives for the market.
Kolanovic’s bearishness is at odds with most other economists. They see the chances of a recession in 2024 dwindling. The consensus is for economic growth to bottom out at an inflation-adjusted 1.4% in the third quarter, according to the Wall Street Journal (WSJ). Kolanovic’s bearishness is not without reason though. In fact, there are more than a few leading indicators pointing toward recession.
The 10-year/3Mth yield curve inversion is a reliable signal of recession.

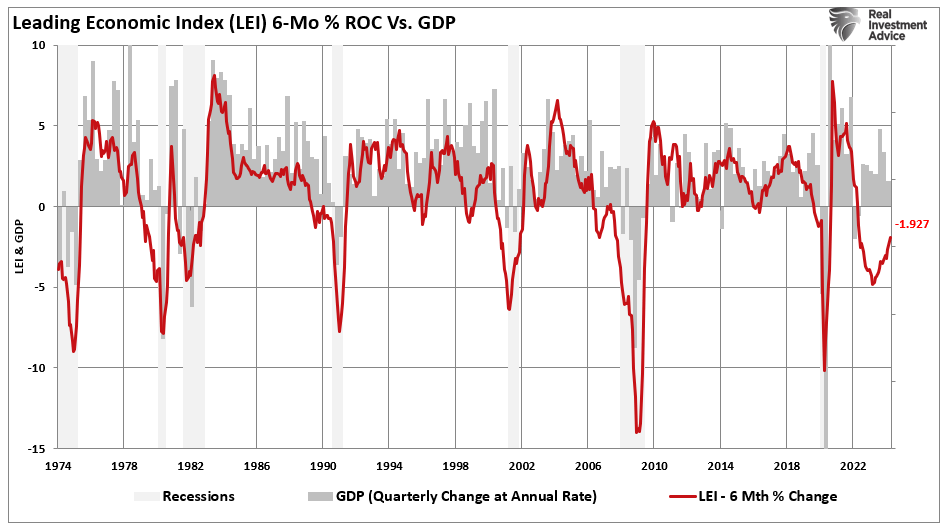
The 6-month rate of change of the Consumer Conference Board’s Leading Economic Index (LEI) is another reliable indicator. The current depth and duration of the LEI’s negative readings have always coincided with a recession.
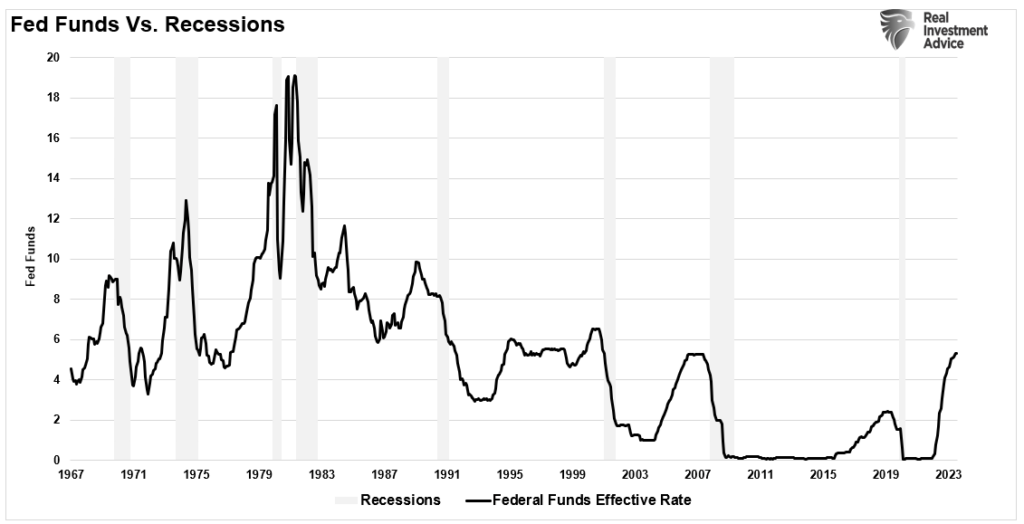
The Fed funds rate-hiking campaign has been the fastest and one of the most aggressive in history.
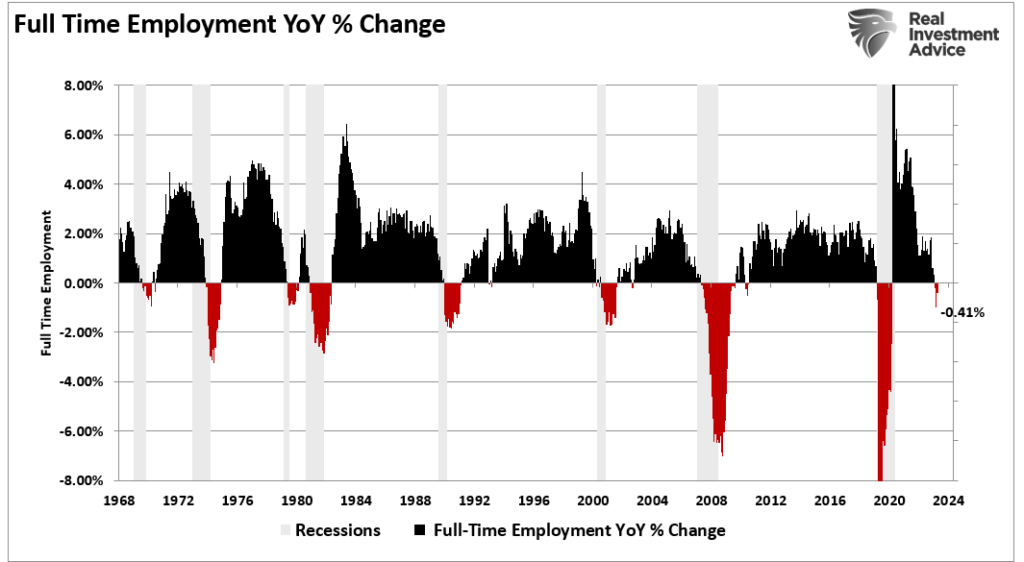
The consumer is 70% of the economy. Full time jobs provide the wages and benefits that allow consumers to consume. A reversal of full-time employment is a leading indicator of consumer spending. A reversal in full-time employment has been a leading indicator for every previous recession.
The risk is to the downside for the economy and stock market for the rest of 2024. Uncertainty remains high and risk management remains a priority.
Economic Indicators
Last week was light on economic news. The economic reports that were released were strong though. Initial jobless claims fell to 215,000 from 223,000. Durable goods orders were strong, rising by 0.7% against a forecast of negative 0.5%. Durable goods minus transportation rose 0.4% in April up from 0.0% the prior month.
As well, The S&P flash U.S. services PMI rose to a 12-month high of 54.8 in May, up from 51.3 the prior month. The S&P flash U.S. manufacturing PMI rose to 52.4 in May from 51.1 the prior month. Any number above 50 shows expansion.
There was no data out last week to support a Fed rate cut.
Indexing Can Be Dangerous
Norwood Economics recommends index funds to our retirement plan clients. We use index target date funds. We also have a lineup of individual index funds that we recommend. We offer our retirement plan clients diversified model portfolios as well. These portfolios are composed primarily of index funds. Indexing makes sense if you don’t have access to a competent stock picker. But index funds should be used to construct a diversified portfolio, not as stand alone investments.
Many people fail to understand that the S&P 500 is not a diversified portfolio. Putting most of your hard-earned money into a single concentrated index is a mistake. Yet that is exactly what many investors do when a bull market is running.
Investors can’t help comparing their portfolio returns to a major index, usually the S&P 500. Comparing leads to unhappiness during a bull market. Comparison in financial markets can lead to terrible decisions, writes Lance Roberts, a partner at RIA Advisors in Houston Texas. He goes on to write that “this ongoing measurement against some random benchmark index remains the key reason investors have trouble patiently sitting on their hands and letting whatever process they are comfortable with work for them.” He is right.
The rise of indexing has investors taking more risk. Investors want to keep up with the S&P 500. They put more (most) of their portfolio into the S&P 500 when the bull is running. The S&P is not a diversified portfolio. The combined market cap of the largest seven companies in the S&P 500 is around $12.3 trillion. The Russell 2000 small-cap index has a total market cap of around $3 trillion. The S&P 500 has 65 tech stocks representing between 30% and 35% of the index’s market cap. There are no small or mid-cap stocks in it. There are no international or emerging market stocks in it. Concentrated portfolios are more volatile. Volatility equals risk.
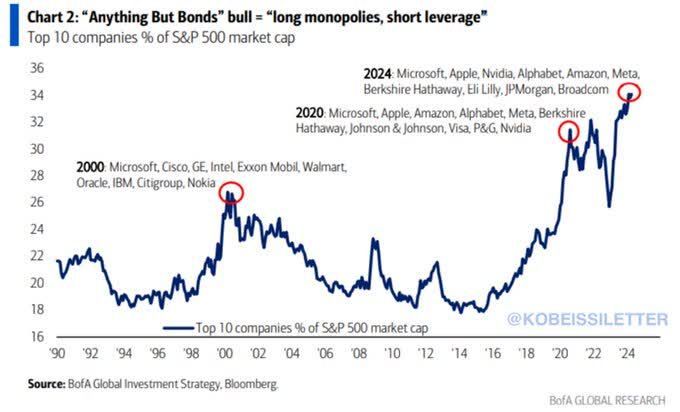
Investing in the S&P 500 index means that almost 35% of each new dollar invested goes into the ten largest stocks, regardless of price. It’s a wonderful dynamic during a bull market. It’s a devastating dynamic during a bear market. Perhaps that is why we’ve seen two bear markets in the last 24 years in which the S&P 500 fell by 50% or more. There is nothing wrong with indexing if the resulting portfolio is diversified. That means using more than one index. An investor should have exposure to small, mid, and large-cap stocks. They should also have exposure to international and emerging market stocks. Older investors should have some exposure to fixed income as well.
Don’t make the mistake of loading up on the S&P 500 during a bull market. The ride up is a rush, but the ride down can be ruinous.
Regards,
Christopher R Norwood, CFA
Chief Market Strategist


