

- No Rate Cuts Likely in June or July
- Benchmark Against a Real Rate of Return
Market Update
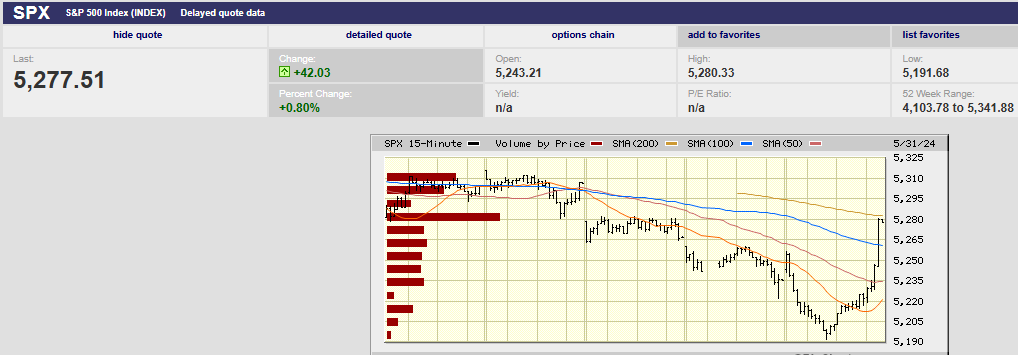
The S&P fell 0.5% last week to finish at 5,277.51. The index was down 2.1% on the week by 12:30 on Friday. A bounce started around noon. It transformed into a melt-up during the last hour of trading. The S&P gained almost 60 points in the last hour and fifteen minutes of trading. It gained almost 50 points from 3:15 to 3:45. That kind of action suggests short covering or panic buying. There was no fundamental news surrounding the surge higher. We wrote in last week’s newsletter that, “The outside down day and weak market internals Thursday suggests a period of consolidation. The odds favor a down week this week, or perhaps more sideways trading.”
Last week’s action qualified as sideways, but only because of the furious last hour rally on Friday. Otherwise, it would have been a solidly down week for the index. The S&P 500 may be entering a period of weeks or even months in which it advances little, if at all. Earnings season is over. The next Federal Reserve meeting in June is expected to be a non-event. The CME FedWatch tool indicates a 95.6% chance that the fed funds rate will remain at 5.25%-5.50%. Trading volume will dry up during the summer months. The most likely course for the market is to continue sideways until the fall. Next most likely is a correction of 10% or so. Least likely is a continued advance. The S&P is expensive and there doesn’t appear to be a catalyst for higher prices. There are catalysts for lower prices.
Inflation is one factor that could tilt the market into a correction. The inflation news hasn’t been great of late. The Personnel Consumption Expenditure (PCE) Index was released Friday morning. The index rose 2.7% year-over-year in April, following gains of 2.7% in March and 2.5% in both January and February. The core PCE rose 0.2% in April, down from 0.3% the prior month. But core PCE year-over-year rose 2.8% in April, the same as the prior month.
The Fed isn’t expected to cut rates in June or July. September may see a cut. The futures market has the odds at 47.0%. The futures market has the odds of no cut at 45.2%, basically a tossup. It’s unlikely that inflation data will cooperate between now and September though. Norwood Economics isn't expecting a September cut. The problem has to do with base effects. The PCE price index rose by 0.1% in May 2023, 0.2% in June 2023, and 0.1% in July 2023. Any number above those 2023 numbers means rising inflation, not falling. The PCE price index hasn’t risen by less than 0.3% a month so far in 2024.The Fed will struggle to justify cuts with a rising PCE.
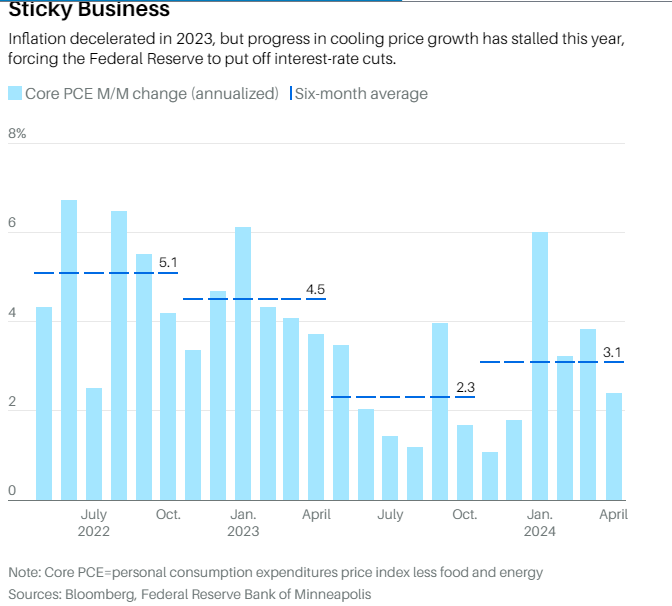
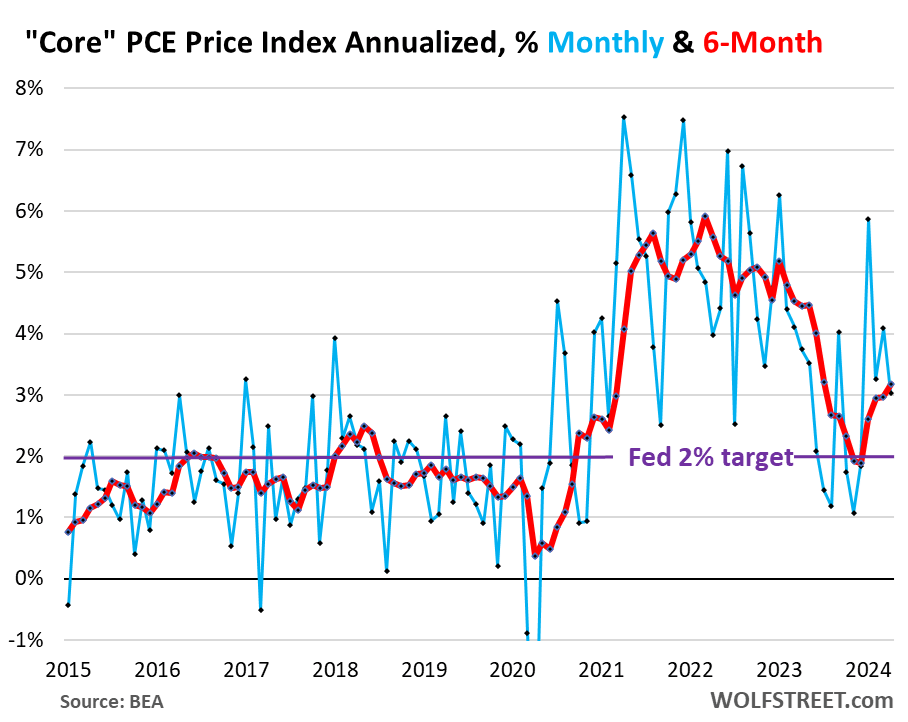
The six-month annualized core PCE price index smooths out trends. It rose to 3.2% in April, the worst increase since July of 2023.
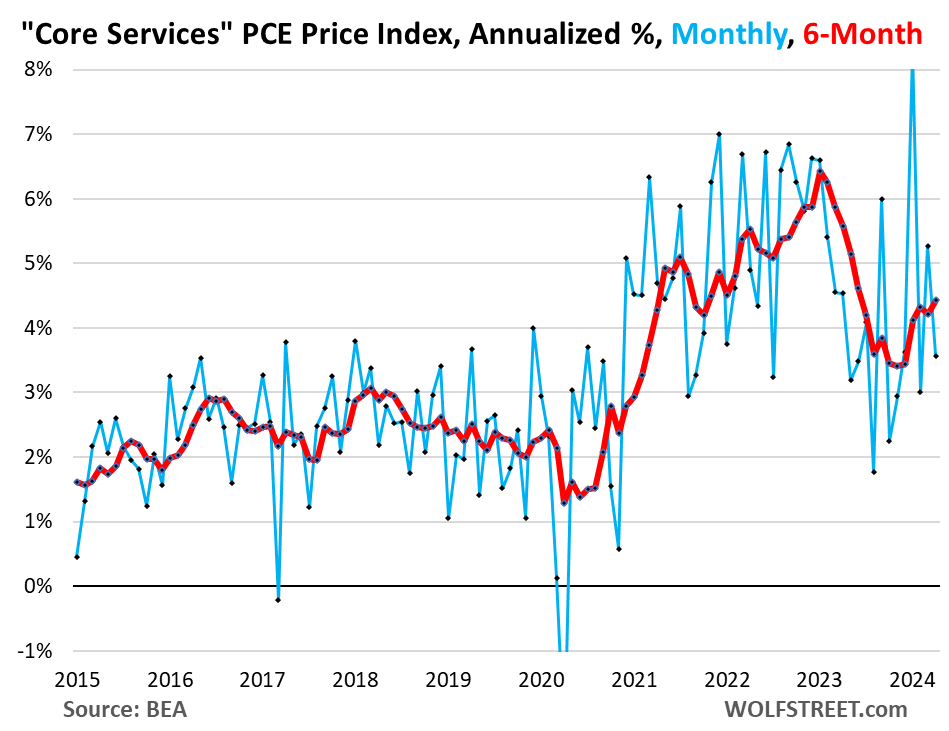
The six-month core services PCE index jumped by 4.4% annualized. It was the highest increase since June of last year, according to Wolfe Research. Core services is where inflation is entrenched. Core services include housing, healthcare, insurance, transportation services, communications services, and entertainment. The Federal Reserve is focused on core services excluding shelter. Powell cites it often during his press conferences.
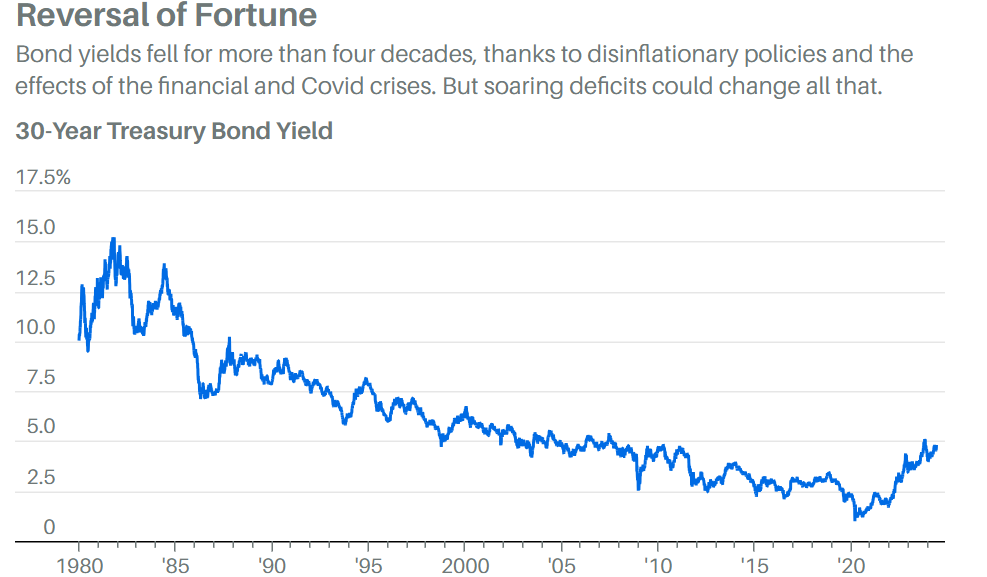
Long bond rates have risen this year, perhaps because inflation isn’t cooperating. The 10-year Treasury yield ended the week at 4.50% up from 4.46% the prior week. It began the year under 4%. The two-year yield ended the week at 4.91% down from 4.95%. Treasury auctions weren’t well bid earlier in the week. It’s a worrisome sign. Governments can borrow money if investors are willing to lend it. Last week’s auctions are a sign that investors won’t lend unlimited amounts. “Buyers’ resistance was evident in poorly bid Treasury auctions this past week," according to Barron’s. The next generation of bond vigilantes (the originals rode in the 1990s) may be reassessing just how much deficit spending the bond market is willing to tolerate.
Higher interest rates due to stubborn inflation might pressure the stock market. Also, continued bullishness among fund managers could prevent prices from moving higher. Fund managers have only 4% of their portfolios in cash, according to a Bank of America survey. That’s the lowest level in three months. Anything below 4% is a sell signal, according to BofA. Finally, there are signs the economy is slowing. The Bureau of Economic Analysis (BEA) revised first-quarter U.S. gross-domestic-product growth down to 1.3% from 1.6%. A slower economy will pressure earnings in the coming quarters.
All in all, risk remains higher than normal and risk management is paramount.
Economic Indicators
Home prices rose 7.4% in March, up from 7.3% the prior month. Home affordability remains low. Pending home sales fell 7.7% in April versus a 3.4% rise the previous month. That is the lowest level in four years. "The impact of escalating interest rates throughout April dampened home buying, even with more inventory in the market," the National Association of Realtors said Thursday. Buyers are pulling back on signing contracts on homes for sale. Declining housing activity will impact economic growth.
The U.S. index of consumer confidence rebounded to 102 in May from a revised 97.5 in the prior month, the Conference Board said Tuesday. This is the first increase in the index after three straight monthly declines. Initial jobless claims remained low at 219,000, up from 216,000 the prior week. First quarter GDP growth was revised down to 1.3% from 1.6%. The consensus had been for a revision to 1.2%.
The PCE data came in as expected with core rising 0.2% on the month and 2.8% year-over-year. Unfortunately, little progress is being made so far in 2024. The core rate of inflation over the trailing 12 months stayed at 2.8% for the third month in a row.
It was a mixed bag of economic news last week. A downward revision in first quarter GDP growth and a sharp drop in home sales showed weakness. Rising consumer confidence, low weekly jobless claims and a core PCE report showing no gains in the inflation fight continue to argue against Fed rate cuts.
The Fed is still looking for a reason to cut. It didn't get what it needs last week.
More on Benchmarking: Benchmark Against Real Rates of Return
I met with a client last week. It was annual review time. She reads our newsletter, which means interesting questions! She asked me at our meeting about benchmarking against the S&P 500. (I've been writing about it recently.) Specifically, she asked how I’m explaining the large recent underperformance to clients and prospects.
A complicated topic and an important one. First, I pointed out that the S&P 500 is a concentrated index. Some 30% of the index is technology. Around 33% is in only 10 stocks. The S&P holds no small or mid cap stocks, no international or emerging market stocks. There aren’t any bonds in the S&P 500 index either. Benchmarking a diversified portfolio against a single concentrated stock index is as apples to oranges as you can get.
I also pointed out that short-term results aren’t particularly meaningful. It’s true our individual stock portfolio has trailed the S&P 500 over the last year. It’s also true that our clients’ stock portfolios have outperformed over the last five years. Recency bias is alive and well though. Most folks tend to pay attention to the short-term results, considering them more important. They are not of course.
I concluded by tying our investment results to her retirement. The real rate of return needed to meet her spending goals is the only benchmark that matters. Norwood Economics starts with a financial plan. We use our MoneyGuidePro software to calculate the real rate of return needed to meet all spending goals on time. That real rate of return determines what type of portfolio we build. Most of our clients are in diversified portfolios that hold stocks, bonds, real estate, and precious metals. Our stock holdings include emerging market, international developed and U.S. We get our emerging market exposure through Vanguard’s emerging market index ETF. Our international developed and U.S. stock exposure comes from buying good companies on sale (in our judgment).
Our goal is to earn the real rate of return needed for our clients to meet their spending goals. We want to take as little risk as possible while earning that real rate of return. None of our approach has anything to do with benchmarking portfolios against an arbitrary concentrated index of large cap U.S. stocks.
My client asked a great question. She had follow-up questions as well. It was a nice conversation about an important aspect of wealth management. Chasing performance in a random index doesn’t help ensure a comfortable retirement. On the contrary, it can ruin your retirement. Avoid the temptation. Stay focused on the goal.
Regards,
Christopher R Norwood, CFA
Chief Market Strategist


