

Narrow Markets are Fragile
THE LARGEST MARKET CAP COMPANIES WILL EVENTUALLY FALL FROM GRACE
Market Update
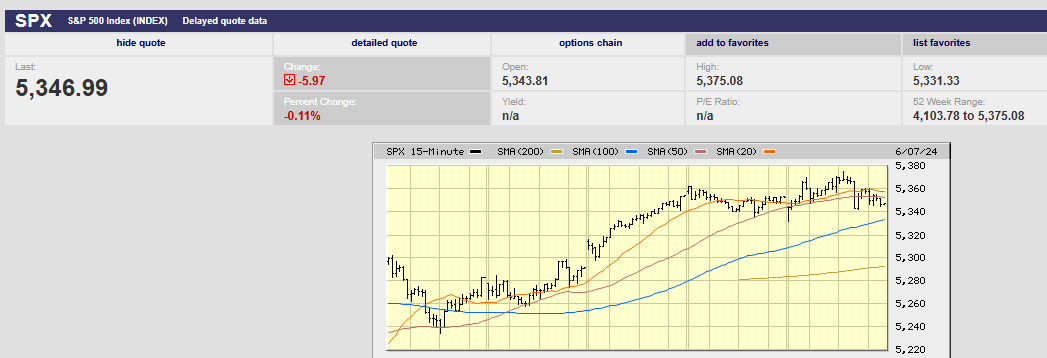
The S&P 500 rose 1.0% last week to finish at 5,346.99. It hit an all-time high of 5,375.08 along the way. The last hour melt up from the prior Friday continued Monday morning, sort of. The index gapped up at the open but hit a high for the day of 5,302.11 in the first 30 minutes of trading. The S&P bottomed for the day and week Monday morning at 5,234.32. It was a steady climb higher the rest of the week. The S&P hit its high for the week and the year around 1:30 on Friday. Early lows and late highs are bullish during daily trading. Lows early in the week and highs late in the week are also bullish.
The stock market is still a narrow affair though. The Magnificent Seven stocks were responsible for more than half of the S&P 500’s gains of 26.3% during 2023. The Magnificent Seven contributed 39.8% to the total return of the MSCI ACWI Index (all-country) in 2023. They have contributed more than a third of 2024 S&P 500 gains.
Microsoft, Nvidia, and Apple now account for 20% of the S&P 500’s market capitalization. It is the first time on record that three stocks have accounted for at least 20% of the market since at least 2000, according to Dow Jones Market Data. Bear Traps Report founder Larry McDonald told Barrons' his data shows that three stocks hitting the 20% threshold is a first. Furthermore, McDonald says that top 10 stocks’ concentration has “tended to hover around the 20% mark” over the last 40 years. It’s currently over 30%.
Why does it matter?
Because narrow markets are fragile. The handful of stocks driving the market higher will start to underperform eventually. They always do. Size is a constraint that grows more powerful as market caps get bigger. It’s basic economics. Large capitalization companies become large cap because of rapid earnings growth. The stock market rewards rapid earnings growth with higher price-to-earnings multiples. But growth rates slow eventually– always. Price-to-earnings multiples contract as growth slows. The combination of slowing earnings growth and lower P/E multiples is a double whammy. Market cap growth slows or even reverses. The big contributions to stock market returns diminish. The mega-cap stocks fall back into the pack. It’s not uncommon for some to disappear altogether. Cisco hasn’t disappeared but it has fallen from the largest company in the world to 61st place, for example.
Let’s look at an example of how the math works. A $50 billion company can grow earnings at 20% or more. It isn't too big yet for growth that fast. The company's total addressable market (TAM) is large relative to its market cap. A $50 billion market cap company earning $2.5 billion is trading at 20x earnings. Growing earnings by 20% the following year bring earnings to $3 billion. The company’s market cap grows to $60 billion if investors are still paying 20x earnings. Earnings growth of 20% is doable for a company that size with products and services that are in demand. That’s because the company’s revenue is still small relative to the size of its TAM and the economy. That is not the case for a $3 trillion market cap company. A $3 trillion market cap company can't grow earnings at 20% or more, at least not for long.
Here's the math with a $2 trillion market cap company. (Currently Microsoft, Apple, Nvidia, Alphabet, Amazon, and Meta Platforms all have market caps of $2 trillion or more.) The U.S. economy is only $35 trillion. Each is valued at 5.7% or more of the entire U.S. economy. Those six companies are valued at more than $14 trillion, or 40% of the U.S. economy. The Magnificent Six (bye bye Tesla) stocks are currently valued at more than the Japanese, Canadian, and U.K. stock markets combined. The Japanese economy is around $4.1 trillion as of June 2024. The six U.S. companies are valued at more than three times the Japanese economy. I'd settle for "just" the Japanese economy in exchange for Microsoft, Apple, Nvidia, Alphabet, Amazon, and Meta. Three times the value of the Japanese economy for those six stocks? Sign me up! Not sure which you'd rather have? Here's a fact: The Japanese economy is far more likely to be around and still growing in fifty years than the six Mega-caps. Stock market history screams that truth.
The Magnificent Six's performance won’t last. Back to basic economics. Their revenue and thus earnings growth will slow as size increases. A company’s revenues can’t be bigger than the economy after all. Thus, all the biggest companies will fall from the top of the leaderboard at some point.
Morgan Stanley recently put out a list of the largest market capitalization companies in the U.S. from 1950 to 2023. The U.S. stock market’s top 10 stocks concentration almost doubled from 14% to 27% in the decade ending last year, according to Morgan Stanley Investment Management’s Michael Mauboussin. There was a 30% concentration peak in 1963 for the top 10 stocks. The lowest concentration was 12% in 1993. The top ten concentration was 14% in 2014. Top ten concentration reached 28% by the end of the first quarter 2024. Mauboussin points out that the increase in concentration in the last decade is the most rapid since 1950. The bottom line is that concentration in the S&P 500 is at an extreme. The Mega-caps are living on borrowed time.
Here's a list of 17 stocks that were among the top three in market cap at the end of the year from 1950 to 2023. Eleven of the 17 were in the top three for more than two years. Four of the stocks on the list made it to number one at some point during a year.
AT&T, General Motors, DuPont de Nemours, Exxon, IBM, Kodak, GE, Atria (Philip Morris), Walmart, Coke, Microsoft, Cisco, Pfizer, Proctor & Gamble, Apple, Alphabet (Google), and Amazon.
Anybody else surprised?
The Mega-caps dominating the U.S. stock market seem invincible now. Many (most?) will fade into the dustbin of history. It's just a question of when. More immediately, the narrow U.S. stock market increases risk for investors, especially those who’re indexing. Buying the S&P 500 index is buying a concentrated portfolio dependent on a handful of stocks. Concentrated portfolios provide wonderful returns at times. They also provide dismal returns at times. Best not to forget that latter fact.
Uncertainty remains high and risk management paramount.
Economic Indicators
The economy is doing fine, at least based on current government economic reports. The Atlanta Fed’s GDPNow tool is predicting 3.1% growth for the second quarter of 2024. The jobs report was strong and stronger than expected. The U.S. employment report showed an increase of 272,000 jobs in May. The U.S. only needs around 100,000 jobs added monthly to absorb labor force growth. The forecast had been for 190,000.
Average hourly earnings rose 0.4%. The yearly increase in wages ticked up to 4.1% from 4.0%. Wage growth stopped falling last fall and has trended sideways since. The unemployment rate did tick up to 4.0% from 3.9%, but that’s still near 50-year lows. It is the first-time unemployment has hit 4% since January 2022. The so-called Sahm rule is supposed to signal the onset of recession. The rule is triggered when the unemployment rate’s nearest-three-month moving average exceeds its lowest value from the past year by at least half a percentage point. That measure was unchanged from April, at 0.37 percentage point.
Economists have had difficulty modeling the U.S. economy since the pandemic. Shutting down and then restarting an economy had never been done before. Supply chain issues were a large part of the inflation problem. Massive fiscal packages to stimulate demand added fuel to the inflation fire. The U.S. labor force was impacted in unexpected ways as well. Many people dropped out of the workforce. The participation rate fell. Labor scarcity materialized. Economists are still trying to make sense of it all.
Perhaps that’s why so many of them have been wrong with their forecasts (including me). The Consumer Conference Board predicted recession by the end of 2022. Bloomberg guaranteed a recession in 2023. The consensus among economists was for recession in 2023. Now it is for 2025 or beyond. Distortions from the pandemic still abound. Forecasting is likely to remain even more difficult than usual.
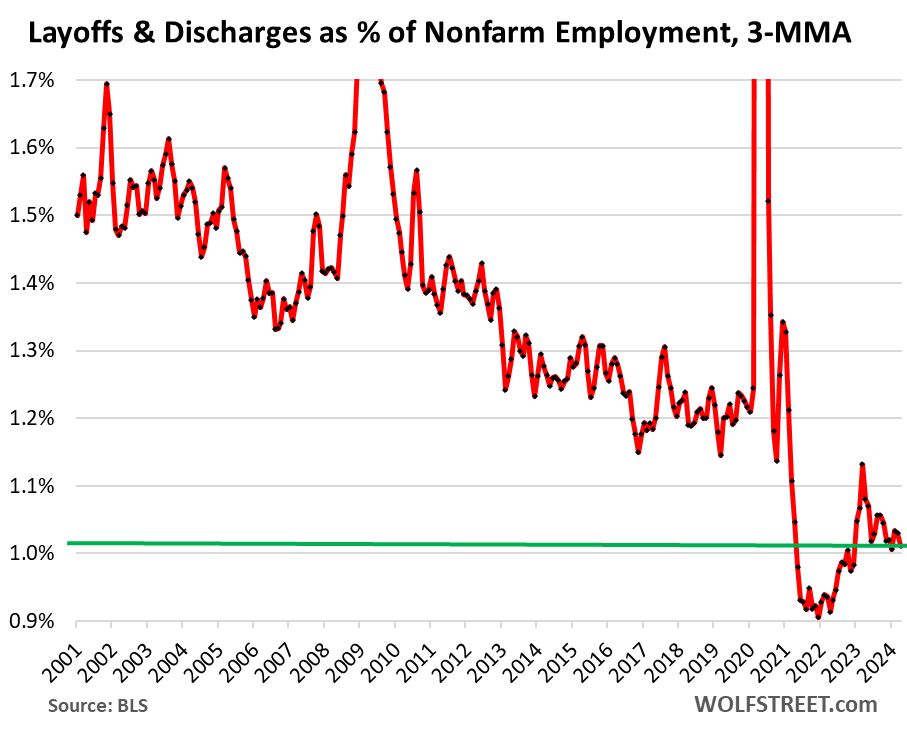
Layoffs and discharges averaged 1.8 million per month from 2014 through 2019. Monthly layoffs and discharges rose to around 10 million during the pandemic.

Layoffs and discharges fell to 0.96% of total nonfarm employment in April. It's the lowest since November 2022. The three-month average fell to 1.01%, far below the pre-pandemic range
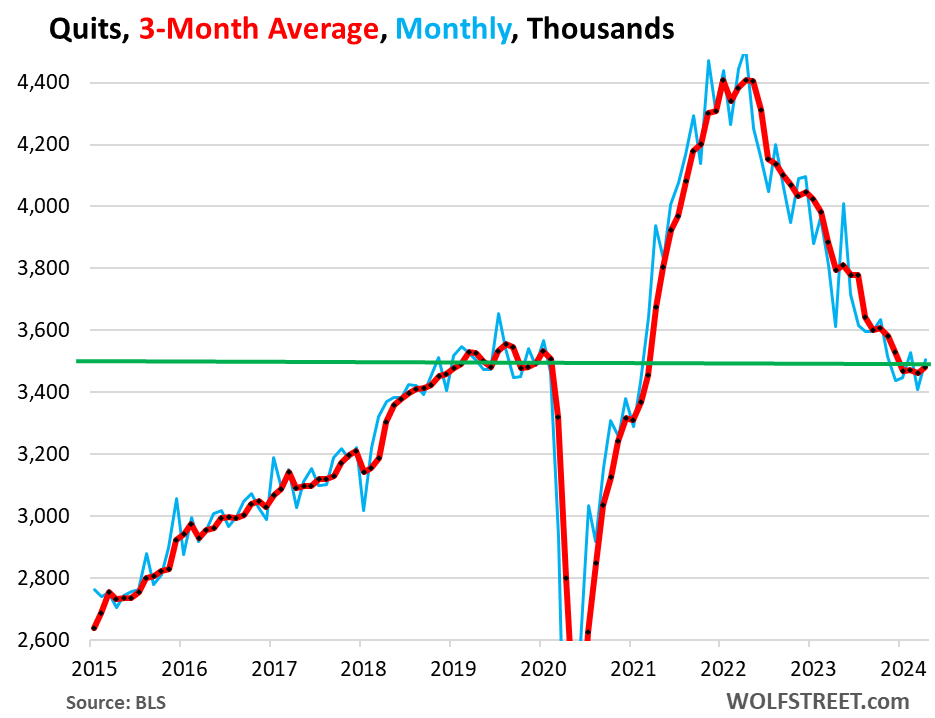
Quits have now stabilized at the level where they’d been before the pandemic.
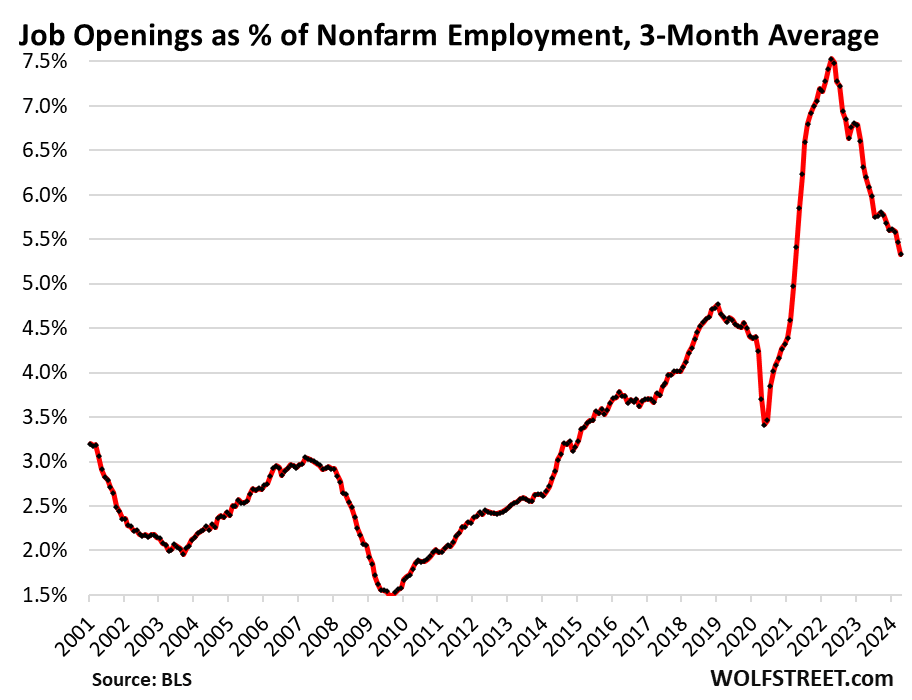
Job Openings are still falling but remain well above pre-pandemic levels.
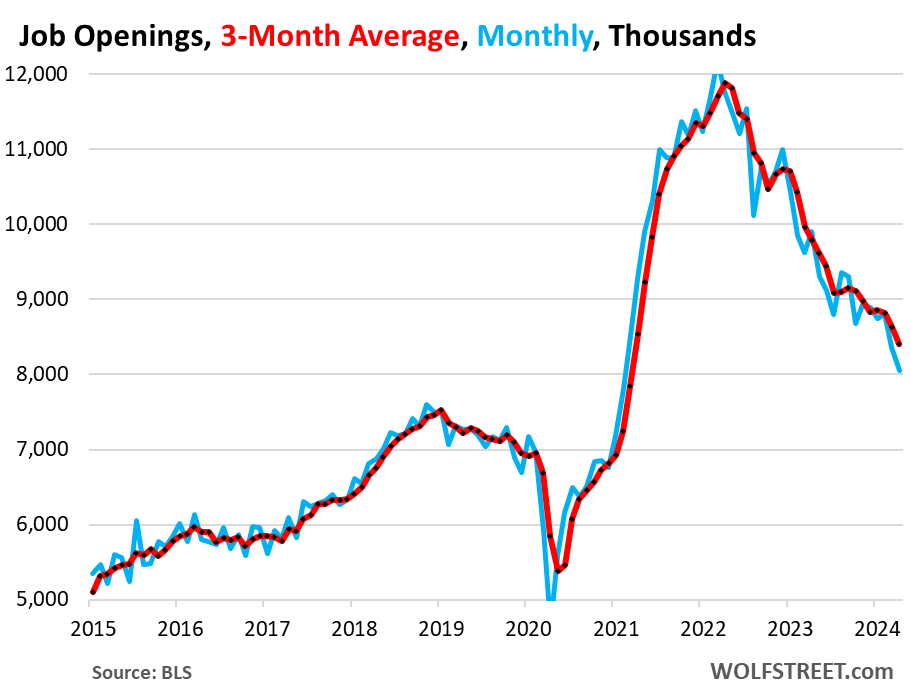
Job openings as a % of Nonfarm Employment are falling but are still well above pre-pandemic levels.
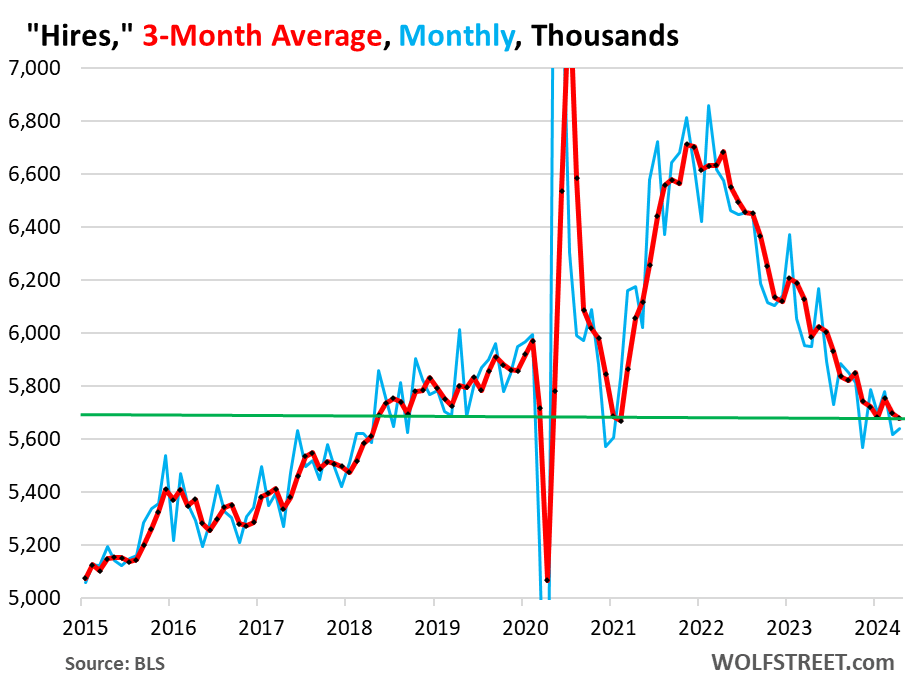
Fewer people quitting their jobs means fewer hirings needed. Hires are back to pre-pandemic levels.
Taken together it appears that the jobs market is still normalizing. Pandemic distortions are still working their way out of the data. Economists will remain even more challenged than usual in the coming quarters.
Investors Intelligence: The Granddaddy of Market Sentiment Indicators
Earnings and interest rates drive stock returns over the long term, say ten years or more. Sentiment drives the stock market over shorter periods of time. It’s why Ben Graham, the father of securities analysis wrote that, “In the short run, the market is a voting machine but in the long run, it is a weighing machine.”
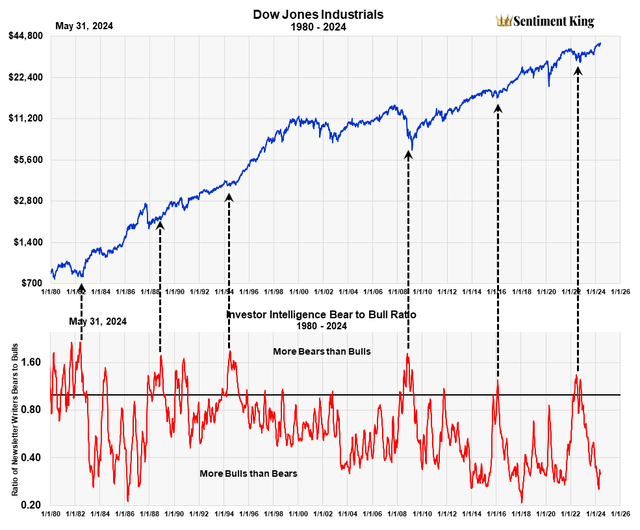
Sentiment is driving the stock market higher now. Bullishness is rampant. But sometimes sentiment can be a contrary indicator. The granddaddy of all sentiment indicators is signaling caution. Investors Intelligence has monitored the bullish and bearish opinions of stock market newsletter writers since 1964. This long history has made it the premier indicator of investor sentiment over the years. The Investors Intelligence Sentiment Survey is a classic contrary opinion indicator.
History shows we should expect trouble when "too many" newsletter writers are bullish. Likewise, we should be optimistic when too many newsletter writers are bearish. Below you can see six times in the last 44 years when the ratio of bearish newsletter writers hit highs. Major bull markets followed. The last signal occurred in December of 2022.
Below is a second chart using the AAII Sentiment Indicator. It is the same data but on a scale showing where the ratio is against historic values. Currently the indicator is registering extreme bullishness. Corrections or bear markets have almost always occurred shortly following extreme bullishness readings.

Sentiment doesn’t make for a precise timing tool. It does give us useful warnings when sentiment is hitting extremes. Caution is warranted given how bullish newsletter writers are currently.
Regards,
Christopher R Norwood, CFA
Chief Market Strategist


