

- The Federal Reserve is Not Data Dependent
- It Uses Models to Forecast
- Its Forecasting Track Record is Poor

5-day S&P 500
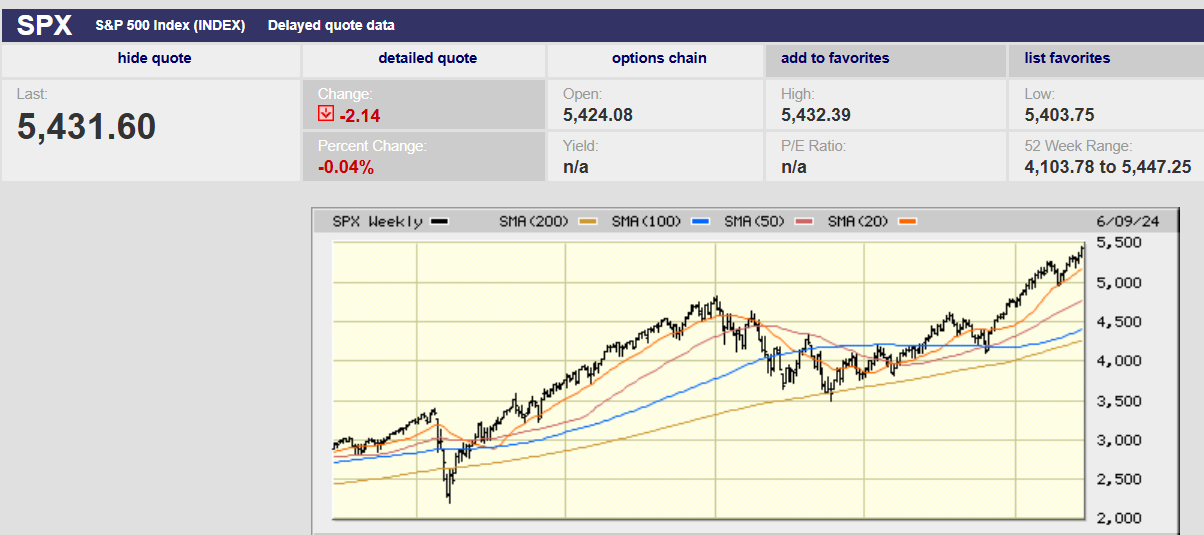
5-year S&P 500
Market Update
The S&P 500 rose 1.6% to finish at 5431.60 last week. The market moving news came Wednesday. The Consumer Price Index (CPI) was released Wednesday morning. The Federal Reserve Board announced the results of its meeting Wednesday afternoon. The CPI report was better than expected. The May CPI came in flat at 0.0%, below the expected rise of 0.1%. April saw a 0.3% increase. The improvement got investors’ attention. The S&P gapped up at the open on Wednesday. It climbed 1.3% before hitting its high for the day and week at 5,447.25 around 10:30 A.M. The S&P lost ground the rest of the week.
The stock market’s bull run continued last week. Credit was given to the CPI report. Of course, the Federal Reserve uses the personal consumption expenditure (PCE) index when conducting monetary policy. It reportedly does not use the CPI. Bonds rallied. The 10-year Treasury yield fell 0.21%, its best week all year. The 10-year yield ended the week at 4.22%. The two-year yield finished the week at 4.73% down from around 4.9% the week prior.
Investors are pricing in two rate cuts between now and year-end according to the CME FedWatch tool. The odds of the Fed funds rate being 4.75% - 5.00% or less by year-end is now 70.8%. The Fed updated its Summary of Economic Projections (SEP) last week. The Federal Reserve’s updated SEP indicates only one rate cut. One rate cut by year-end is one less than the Fed fund futures market expects.
The Fed's SEP is indicating a rate cut even though the Fed is forecasting GDP growth of 2.1% and unemployment of 4.0% by year-end 2024. The 2.1% growth is above the Fed’s own 1.8% estimate of sustainable growth. The 4.0% unemployment rate is near a 50-year low. So, the Fed is forecasting a strong economy and full employment at year-end... and a rate cut.
The Fed's projections don't gibe with cutting rates. It's puzzling that the Fed is forecasting rate cuts given current economic data and its own projections. Cutting rates when the economy is strong, and the labor force fully employed would be unusual. It’s even harder to understand the Fed cutting rates when it is also expecting core PCE to rise 2.8% by year-end 2024. The 2.8% inflation number is well above the Fed’s 2.0% target. Still, the Fed is forecasting one rate cut in 2024 and four rate cuts in 2025.
The projected cuts still don't make much sense when the Fed's year-end 2025 projections are considered. The Fed's updated SEP indicates GDP growth of 2.0% and core PCE of 2.3% by year-end 2025. The Fed forecasts the US unemployment rate to rise to 4.2% in 2025 before falling back to 4.1% in 2026. That means the Fed is expecting the economy to be growing at or above its sustainable rate by year-end 2025. It means the Fed is expecting unemployment to still be low and inflation to be still above its 2% target. One could argue that those numbers are because of the five projected rate cuts. But how to explain the cuts based on the data? One must conclude that the Fed is not data dependent. Rather they must be following some rule or model.

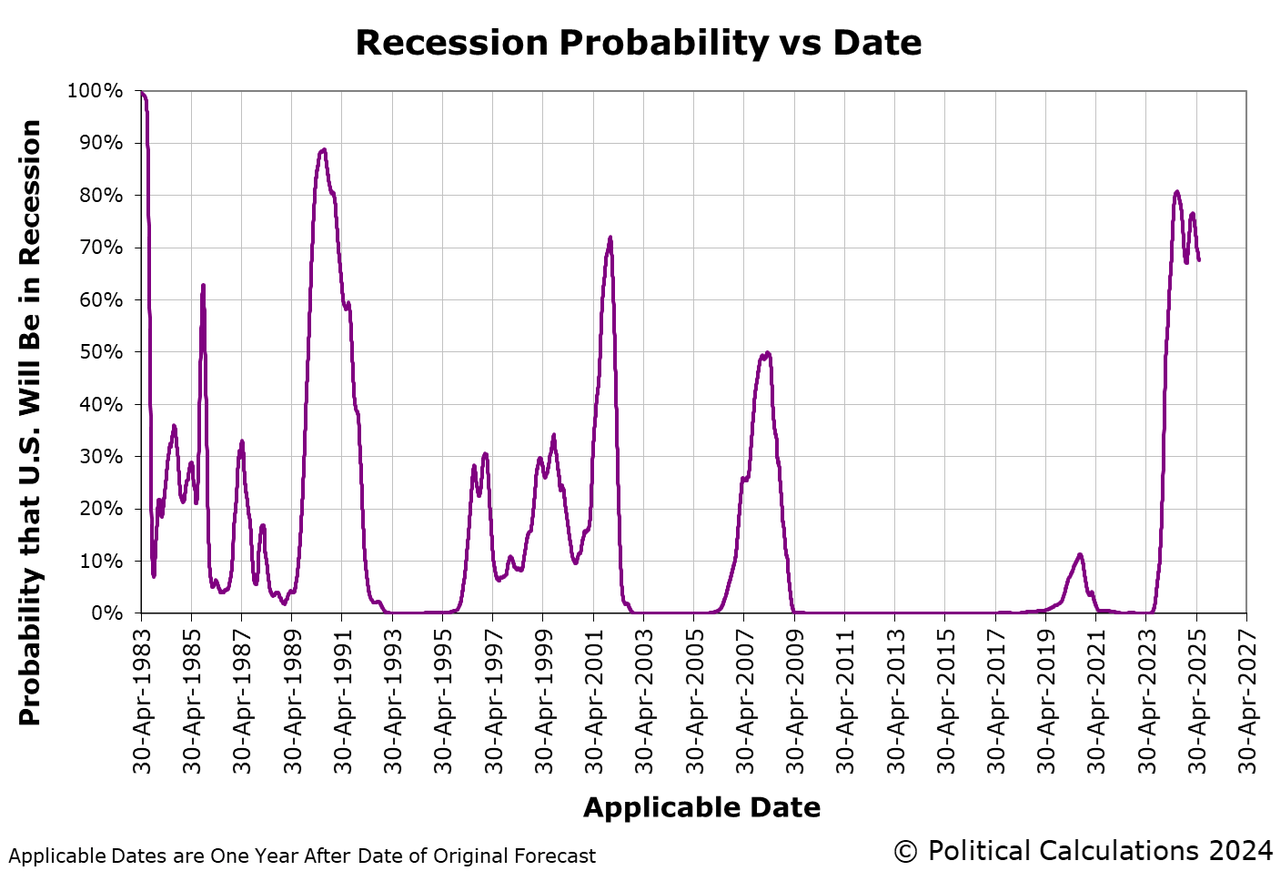
The Fed does use models. Perhaps it is using a model to predict growth, employment and inflation and just doesn't want to tell us. The 10-year/3Mth yield curve is an input in one of its models. Another of its models uses the U.S. Treasury yield curve and the level of the Fed fund rate as inputs. One of its models was developed by Jonathan Wright in 2006 for the Federal Reserve Board. It's currently predicting a 70% chance of a recession. Perhaps that's why the Fed is forecasting five rate cuts by year-end 2025.
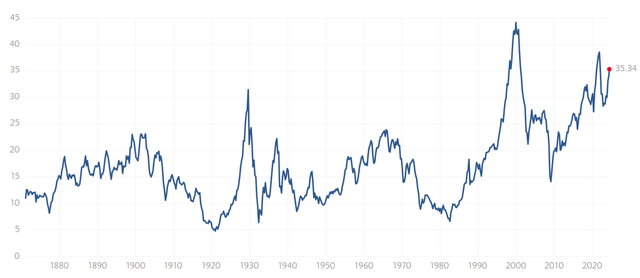
Meanwhile, the stock market is still expensive. The S&P 500 trades at over 21 times expected earnings for the coming year. That is at the high end of the range since the Fed began lifting rates in early 2022. It’s also well above the long-term average of 16-17x forward earnings. Expensive markets aren’t a particularly good timing mechanism though. “Expensive markets can stay expensive for extended periods,” writes Evercore ISI strategist Julian Emanuel. The S&P index traded at over 20 times earnings in 1998 and 2020. It went on to gain for hundreds of days before finally peaking out and experiencing major declines, Emanuel told Barron’s. What’s more, expensive markets can get more expensive. The S&P 500 would hit 6,500 should trailing 12-month price/earnings multiples climb to 28x. It has hit 28x earnings in past bubbles, according to Emanuel. That would be a nearly 20% rise from current levels.
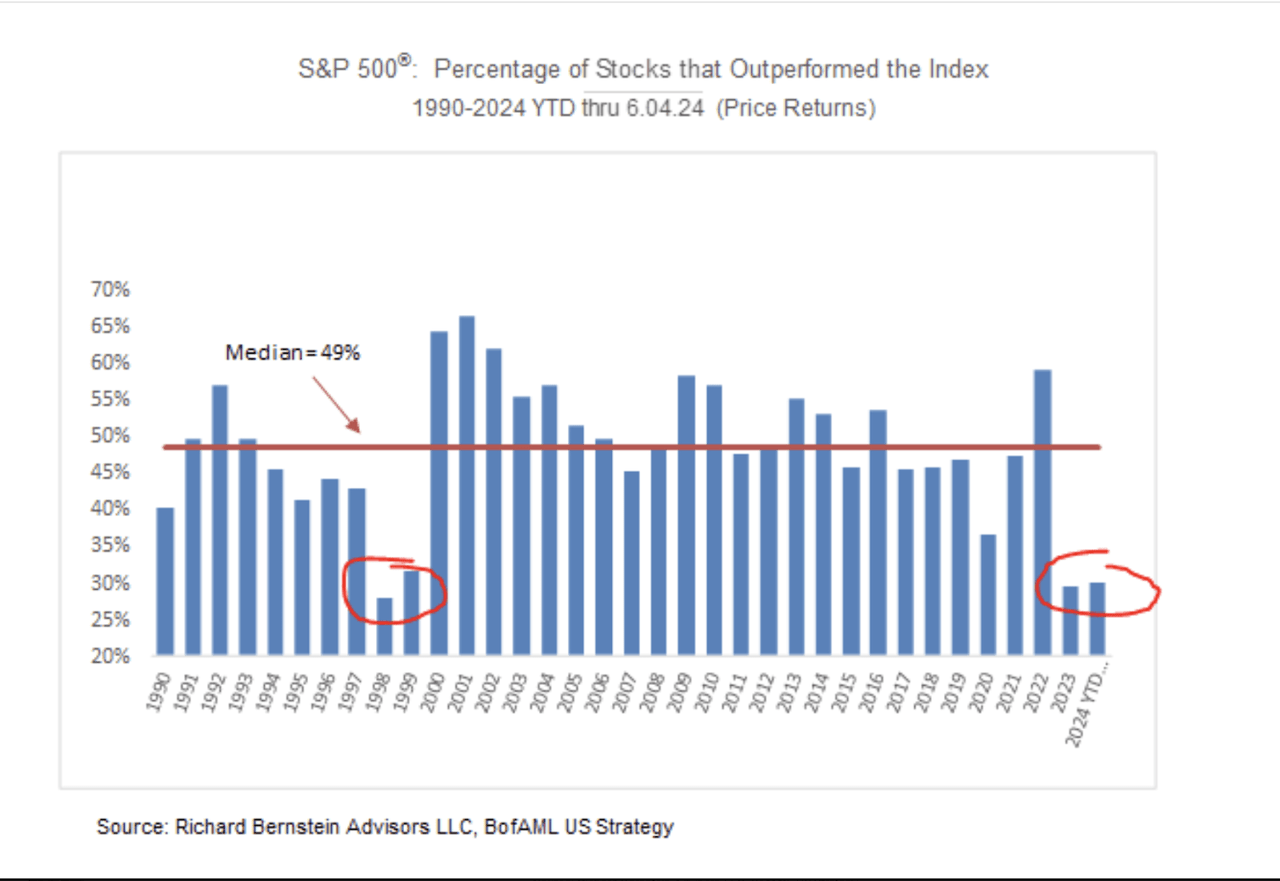
But that gain may not come. We wrote last week about the narrow market and its fragility. Doug Kass, head of Seabreeze Partners, highlighted the narrowness of the 2024 rally in a note last week. He wrote that five stocks Nvidia, Meta Platforms, Alphabet, Microsoft, and Amazon have accounted for 61% of the S&P 500’s return this year. The Magnificent Seven accounted for two-thirds of returns in 2023. The continuing narrowness of the market rally makes it less likely to continue. The Fed’s higher for longer monetary policy makes it more likely the economy will slow, and earnings disappoint.
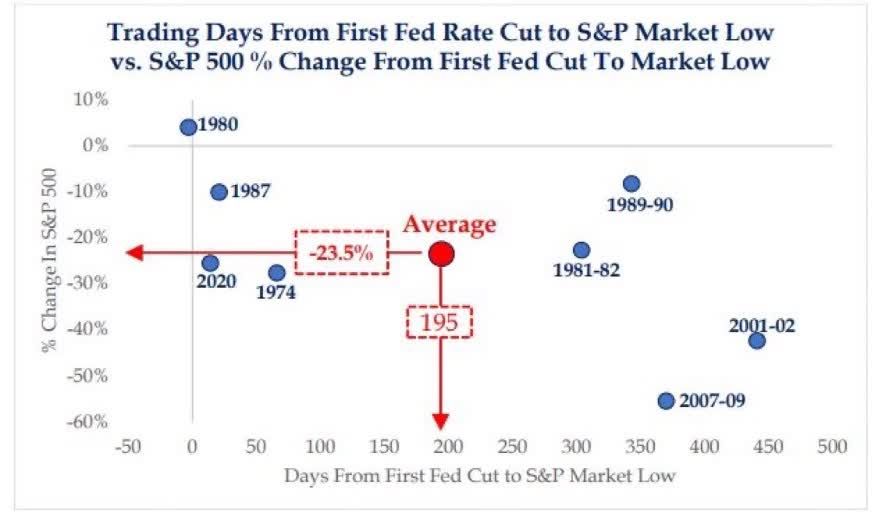
Fed rate cuts don’t necessarily mean a continuation of the bull market. In fact, the norm is for falling markets when the Fed is cutting. The stock market might not fall right away but it is likely to fall after the Fed starts cutting rates.
Uncertainty remains high. Risk management remains paramount.
Economic Indicators
The economy is showing signs of slowing. The labor market is showing signs of softening. The inflation rate continues to slowly fall. The CPI numbers came in better than expected. The core CPI rose 0.2% in May, better than the 0.3% forecasted. Core CPI rose 0.3% in April. Inflation is still too high though. Initial jobless claims were higher than expected and higher than in the recent past. Initial jobless claims were 242,000, up from 229,000 the prior week and higher than the 225,000 forecasted.
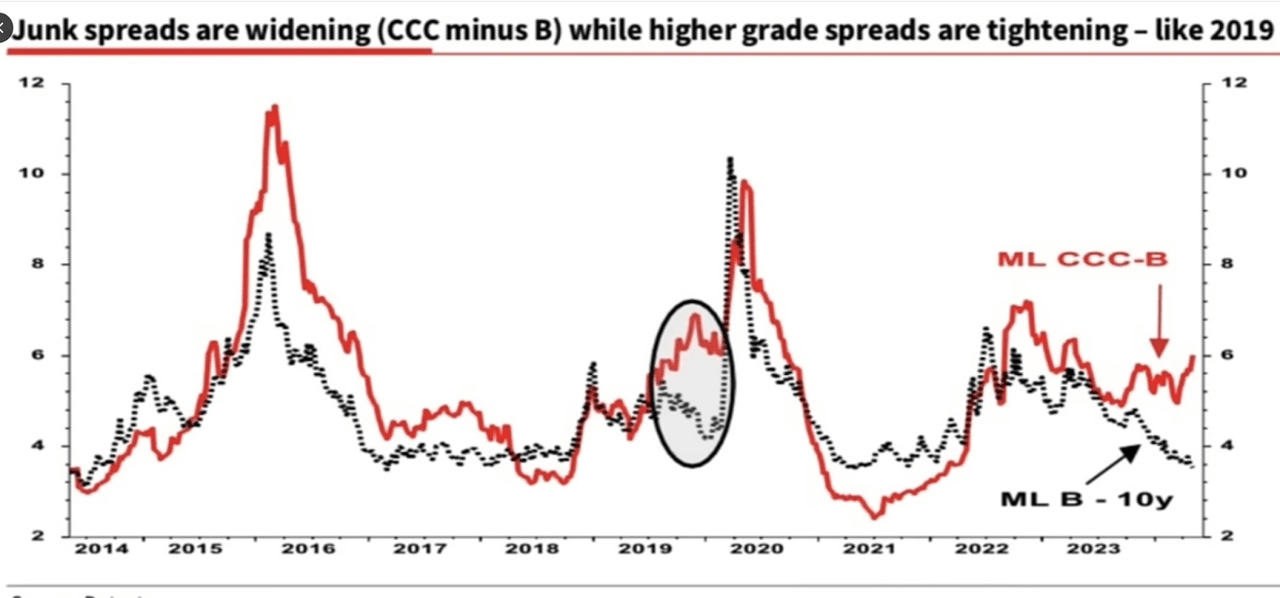
Widening credit spreads can be an early warning of economic stress.
The first of two readings of the consumer-sentiment survey dropped to 65.6 this month from 69.1 in May, the University of Michigan said Friday. The index has fallen three months in a row. It hit a seven-month low due to concerns about inflation and weaker incomes, according to the survey. People are unhappy.
I asked a group of retirement plan participants last week how they thought the economy was doing. One woman said awful. The rest of the group agreed. I asked what about the economy made them feel that way and the same woman responded “Prices”. The other two participants nodded in agreement. They are unhappy about how much prices have gone up in the last few years. So, for them the economy is awful.
The Fed is unlikely to corral inflation without the unemployment rate rising well above its 4.2% 2025 projection. The Fed is also unlikely to push inflation back to 2% without a recession.
More On Medicare
We wrote a few weeks ago about Medicare and the choices people must make. Medicare Advantage has become popular. It’s popular because the premiums are lower. Insurance companies are paid by the government per insured. The insurance company must provide coverage to the insured. They hope the cost of that coverage is less than what they receive from the government. That dynamic creates an obvious problem. Insurance companies have an incentive to deny services.
People who’ve chosen Medicare Advantage are finding that it is expensive to get sick. The point was driven home to me on a recent visit to my parents. They have Medicare Advantage. It was great as long as they stayed healthy. They’ve run into some health issues in the last few years. Now Medicare Advantage isn’t such a great deal. Medical expenses for them have risen rapidly. They are planning on going back to traditional Medicare this fall. Fingers crossed that they will be able to find a Medicare Supplemental plan. Insurance companies aren’t required to offer it to them. We wrote a few weeks ago about that problem. The insurance companies are only required to offer supplemental insurance when a person first becomes eligible for Medicare.
A supplemental policy is important. Medicare Supplement Insurance (Medigap) is extra insurance you can buy from a private health insurance company. It helps pay your share of out-of-pocket costs in Original Medicare. Plan F is the most popular Medicare Supplement plan. Its popularity is due to its coverage of more out-of-pocket Medicare costs than any other Medigap plan type, according to Forbes.
I have my fingers crossed that my parents will be able to get a supplemental policy this fall.
Regards,
Christopher R Norwood, CFA
Chief Market Strategist


