

The short-term downtrend may be over.
Santa Claus rally next?
Market Update
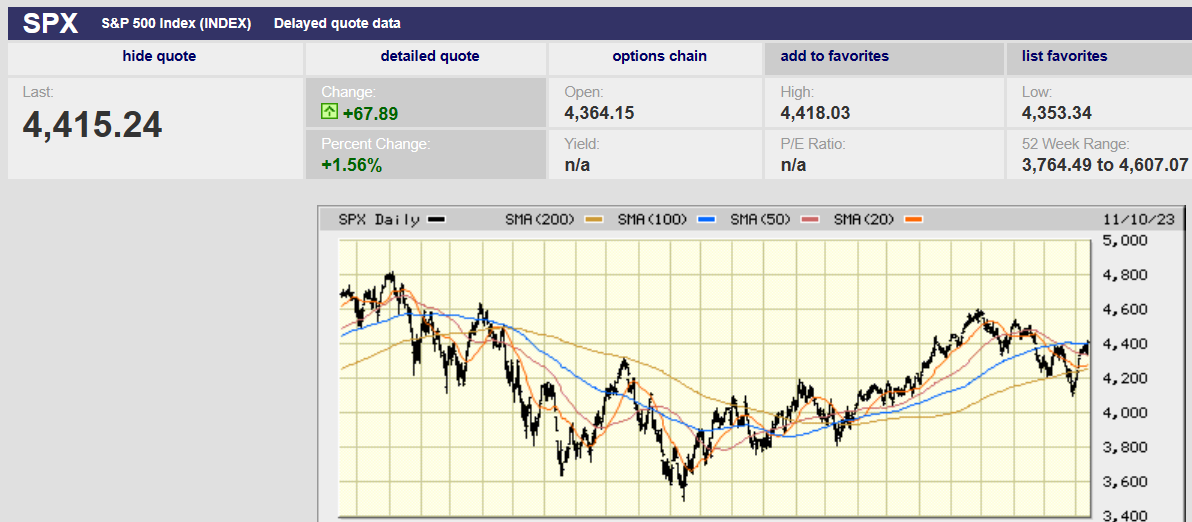
The S&P 500 rose 1.31% to close the week at 4415.24. The Nasdaq rose 2.37%. The 10-year Treasury yield remained at 4.6%. The S&P punched through the 100-day moving average on Friday. Whether it can remain above the 100-day is a question for the coming week. Friday’s trading saw the market gap up at the open. It filled most of the gap and then climbed throughout the day. It closed near the day’s high, a positive for Monday's trading. Friday accounted for more than 100% of the gain for the week. The strong rebound Friday after a weak Thursday may mean there is still more short covering to be done. (Last week's rally in both the stock and bond market was likely short covering).
We wrote last week that it would be tough going from 4,400 to 4,607. That’s still the case. Much will depend on interest rates over the next few months. Interest rates in turn will depend on bond auction results. The next Treasury auction is on 20 November. The Treasury has increased its borrowing as deficit spending has increased. Increased supply is meeting tepid demand causing prices to fall and rates to rise.
Thursday’s $24 billion bond auction of 30-year Treasury bonds was not encouraging. The bond market has shown signs of indigestion in prior auctions. It continued to do so Thursday. More borrowing than expected over the last few months pushed long-term yields higher. The 10-year yield hit 5% at one point. Short covering sent yields lower two weeks ago, but the relief rally may be over. The 10-year Treasury yield has fallen from 5% to 4.66%. But last week’s shaky auction is a sign that the long end of the curve may move higher again.
Thursday’s auction was not well bid. Primary dealers were forced to accept 25% of the $24 billion offering, according to Barron’s. That’s more than double the average over the past year. China and Japan have reduced buying, as has the Federal Reserve. Quantitative easing gave way to quantitative tightening in June of 2022. Increased supply and reduced demand mean lower bond prices. Lower bond prices mean higher yields. The S&P fell 0.8% Thursday in sympathy with the poor bond auction results.
The stock market has an upside bias heading into the holidays. Volume will begin to dry up the week of Thanksgiving. The rise above the 100-day moving average clears the way for a Santa Claus rally. Recall that we wrote last week that, “The three-month downtrend is intact. The S&P will need to rise above the prior high at 4,393.57 to call the downtrend into question.” Mission accomplished. The downtrend that began in July is threatened. We still need a higher lower to confirm a new short-term uptrend. The next resistance is 4511.99 followed by 4541.25.
Rising interest rates could cut the rally short. A bond market choking on increased supply could send the long bond back above 5%. Stocks would likely start declining again if yields moved above 5%. Earnings are the other potential problem. Earnings season is almost over. Around 75% of the S&P 500 companies have reported. Some 80% of companies have beaten estimates, higher than normal. Guidance has been uninspiring though. Companies aren’t raising guidance for 2024. Expectations are already high. The consensus earnings growth estimate is 11.5%. S&P companies have seen earnings shrink for three quarters in a row. Earnings are expected to grow in Q3 by 3.4%. Fourth-quarter estimates have fallen but the consensus is still for 5.4% growth. Earnings growth in Q3 and Q4 would be a welcome change from the prior quarters’ declines.
Still, growth of 11.5% in 2024 is a tall order and unlikely to materialize. Higher interest rates mean less spending. Less spending means lower economic growth which means less profit growth. The market is likely to struggle once earnings estimates start falling. Earnings growth will need to exceed 11.5% in 2024 if the market is to set a new all-time high next year. Possible but not likely. Single-digit earnings growth will lead to a sideways market in the first half of next year. A recession would result in an earnings decline of as much as 30%. The bear market would resume by early next year in that case. Norwood Economics has recession as its base case. A downside move to the October 2022 low should be expected in a recession. The S&P hit 3,491.58 intraday on 13 October 2022. A sideways market is next most likely. A move to new highs next year is least likely.
Uncertainty is still high. The large increase in interest rates and ongoing quantitative tightening argue for caution. Risk management remains a priority.
Recession Watch
Leading indicators continue to line up for recession. Rising unemployment can be added to the growing list signaling recession for 2024. The economy added 150,000 jobs in October, but unemployment rose to 3.9%. It is the highest unemployment rate since January of 2022. Unemployment has risen 0.5% from its cycle low of 3.4% hit in January and April of 2023. When unemployment rises by 0.5% or more within a nine-month period it signals a peak in the economic cycle or a recession, says Michael Darda, chief market strategist at Roth MKM.
Additionally, the Sahm Rule is close to triggering. The current value is 0.43%. The Sahm Rule is triggered if the 3-month average rises by 0.5% or more above the unemployment low of the prior year. Unemployment hit a low of 3.4% in January and April. The 3-month average is 3.83%. A rise in the 3-month average to 3.9% would trigger the rule which has a 100% forecasting accuracy. The Fed is forecasting 4.1% unemployment by year-end 2024. The Fed is notoriously bad at forecasting. Given the many leading indicators pointing at recession it is likely the Sahm Rule will trigger in the next few months. (The rule is named after its creator, former Fed economist Claudia Sahm.)
The yield curve inversion is also signaling recession. And the clock is ticking. A recession starts on average nine months after the maximum inversion point is reached. The maximum inversion likely occurred on March 8, according to Evercore ISI's Julian Emanuel. The two-year Treasury yielded 1.09% more than the 10-year on that date.
A recession is coming based on the March maximum inversion, but nine months is only the average. It has taken as long as 33 months (in 1998). That acknowledged Q1 of 2024 would be nine months. Market risk is increased because the stock market is expecting 11.5% earnings growth for 2024. That puts the S&P 500 at 18x earnings, expensive if not outrageously so. But even a mild recession will result in an earnings decline of 15% or more. An earnings decline would lead to a stock market decline.
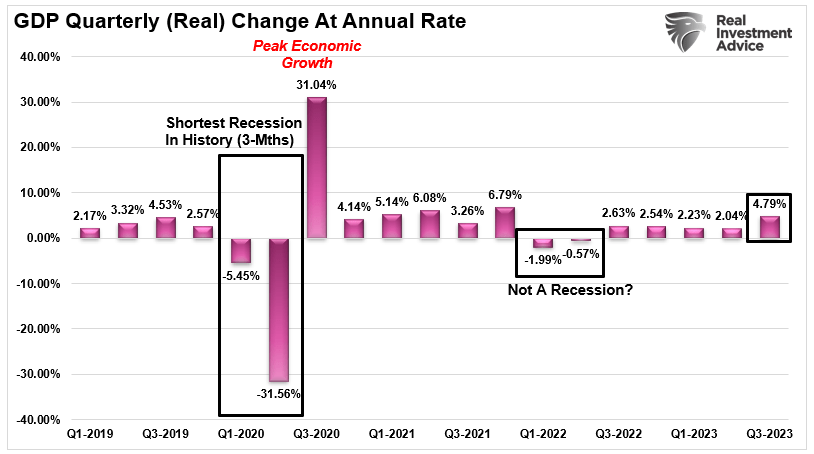
The Gross Domestic Income (GDI) numbers aren’t showing the same strength as the better-known GDP number. The first guess at Q3 GDP was 4.9%. It is a guess because the advanced estimate is “based on source data that are incomplete or subject to further revision by the source agency,” according to the Bureau of Economic Analysis (BEA). Q3 GDI hasn’t been released yet. GDI has diverged significantly over the last few quarters from GDP. FY 2022-23 GDP by quarter was -1.6%, -0.6%, 3.2%, 2.6%, 2.2%, 2.1%, 4.9%. Meanwhile, FY 2022-23 GDI by quarter was 0.5%, 0.0%, 2.7%, -3.0%, 0.5%, 0.7%, TBD. The last three reported quarters have been weak with an average growth of negative 0.6%. It wouldn't be surprising if the Q3 GDI number is negative. It is worth noting that when the two measures diverge it is GDI that tends to be the more accurate.
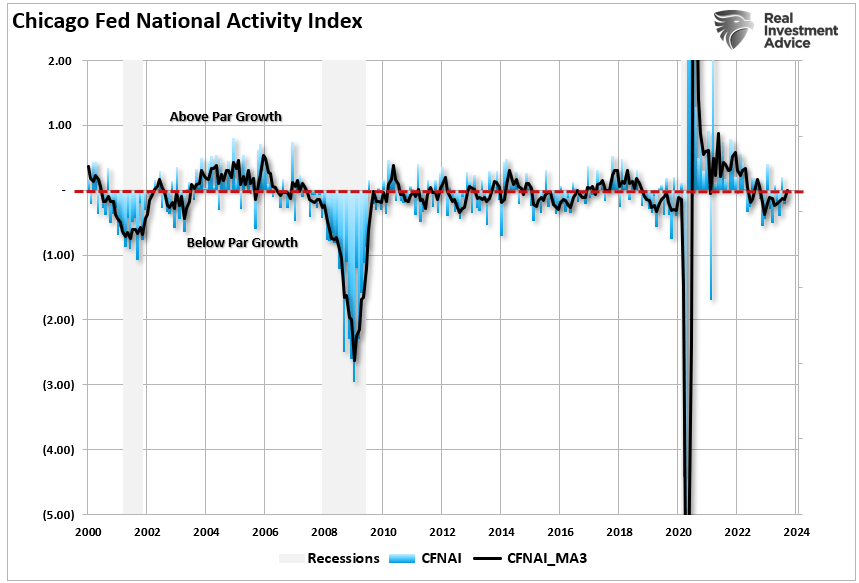
Finally, the Chicago Fed National Activity Index (CFNAI) is not indicating above trend growth. The 3-month moving average is 0.00 for September. A zero value indicates that the economy is growing at trend, or about 2%. The CFNAI is composed of 85 indicators. It is a forward looking metric. The four main sub-categories are highly correlated with the underlying economic reports. The CFNAI is not confirming an economic resurgence. It is likely that Q3 GDP will be revised down. It is also likely that Q4 GDP will be much lower than Q3. The Atlanta Fed GDPNow tool is calling for 2.1% for Q4. A flat number is more likely based on GDI and the CFNAI index.
The economy is weaker than the Q3 GDP number suggests. Money supply is contracting, and the cost of money has risen sharply over the last 18 months. The risk is to the downside for both economic growth and earnings growth. Earnings and interest rates drive the stock market in the long term. Interest rates are high and perhaps still rising. Earnings growth is likely to disappoint next year. Stock market risk is skewed to the downside. Gains are possible in the coming year but sideways to down is more likely.
Regards,
Christopher R Norwood, CFA
Chief Market Strategist


