Short Covering Rally Over

Market Update
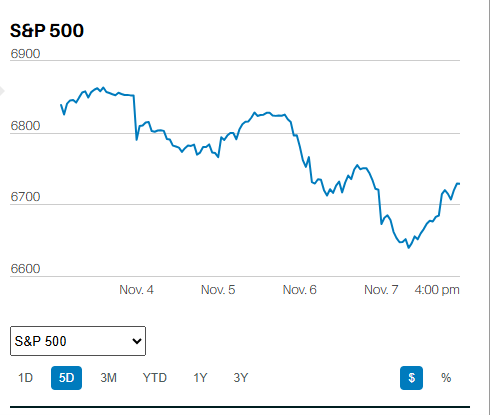
The S&P rose 5.85% last week to finish at 4,358.34. The Nasdaq rose 6.61%. The 10-year Treasury yield fell to 4.57% from over 5% a few weeks ago. The drop in the 10-year Treasury yield can be fairly described as a plunge. The big drop in yields was a catalyst for the big rise in stocks. What happened to drive bonds higher and yields lower?
Nothing much. Yet it was the biggest rally in long-bonds since the plunge in yields in March 2020. That was during the Covid Pandemic. What was the trigger if not a rally based on fundamentals? The most likely explanation for the big rally last week in both bonds and stocks was short covering. Billionaire hedge fund manager Bill Ackman may have set the stage when he closed out a large short position in Treasury bonds recently. The news hit on 23 October. It’s thought Ackman’s Pershing Square made over $1 billion on the bet.
The Treasury may have primed the pump for a bond short-covering rally also. It announced Monday it would borrow slightly less at the long end of the curve and more at the short end. Barron’s pointed at “massive covering of short positions in Treasury bonds and futures,” as the reason for the sharp drop in yields Monday. The trading action and lack of meaningful news suggest Barron's is correct.
Norwood Economics got it right when we wrote last week to, “expect an oversold bounce soon, perhaps even this week.” Norwood got it wrong when we wrote, “Any bounce is unlikely to take us above 4,200 and even less likely to clear the 200-day moving average at 4,240. The S&P finished well above both levels last week as frantic buying caused a melt-up in both bond and stock prices.
The S&P gapped up at the open on Monday, Wednesday, Thursday, and Friday. Those gaps weren’t filled. Wall Street traders have many rules of thumb about how markets trade. One such rule is that the market always fills the gaps, always. The frantic buying throughout the week, with gaps scattered in its wake, suggests the market will revisit last week’s levels. The gaps will be filled. The question is when.
For its part, the media did its best to explain the daily trading action. Barron's pointed at short covering in the bond market as the catalyst for Monday's action. Stocks surged in turn due to falling yields. Other explanations were vaguer. Art Hogan at B. Riley Financial told CNBC that “Oftentimes when you get that kind of negativity going into a weekend… you get a bit of a clawback on Monday.” In other words, the market went up on Monday because it went down the prior Friday.
Barron’s reported Tuesday that, “U.S. stock futures were rising early Tuesday after a strong rebound in the previous session.” In other words, the stock market went up Tuesday because it went up Monday. The Federal Reserve meeting was last Wednesday. The Fed did exactly what the market expected, held the Fed funds rate steady, and made no changes to its outlook. Or maybe it did. Powell hinted at an end to the interest rate cycle at his press conference, according to Bloomberg. Morningstar’s headline was that “Rates Held Steady, But Options Open for One More Hike”. CBS agreed with Morningstar. It reported that the Federal Reserve held out the possibility of more rate hikes. Conflicting takes on the Fed meeting. Investors didn't hesitate though. They continued to frantically buy stocks and bonds the rest of the week.
The bond short-covering rally may be about over though. The iShares 20+ Treasury Bond Index ETF (TLT) gapped up at the open Friday. It spent the rest of the day giving back its opening gains and closed at its low for the day. The gap isn’t closed but may well be by the time trading is over on Monday. The rally in the TLT last week took it above its 20-day moving average. It couldn’t break through the 50-day moving average though. The TLT closed at 87.63. There’s a good chance it will retest 85 in the next few weeks. Bond prices down, yields up. Not a supportive environment for stocks if it comes to pass.
The S&P 500 rose above its 200-day, 20-day, and 50-day in that order last week. Only the 100-day remains at 4,400. It should be tough going for the S&P from here to a new all-time high. Technical resistance runs from 4,400 to 4,607 for starters. Then there's the inconvenient fact that the market is still expensive. Further, earnings estimates are too high for 2024. Consensus is still calling for an 11.9% increase in S&P earnings. Even then the market is trading at 18x 2024 earnings. A 15x P/E is more in line with a 10-year Treasury yield of 4.5%. The S&P at 3,700 would be closer to fair value.
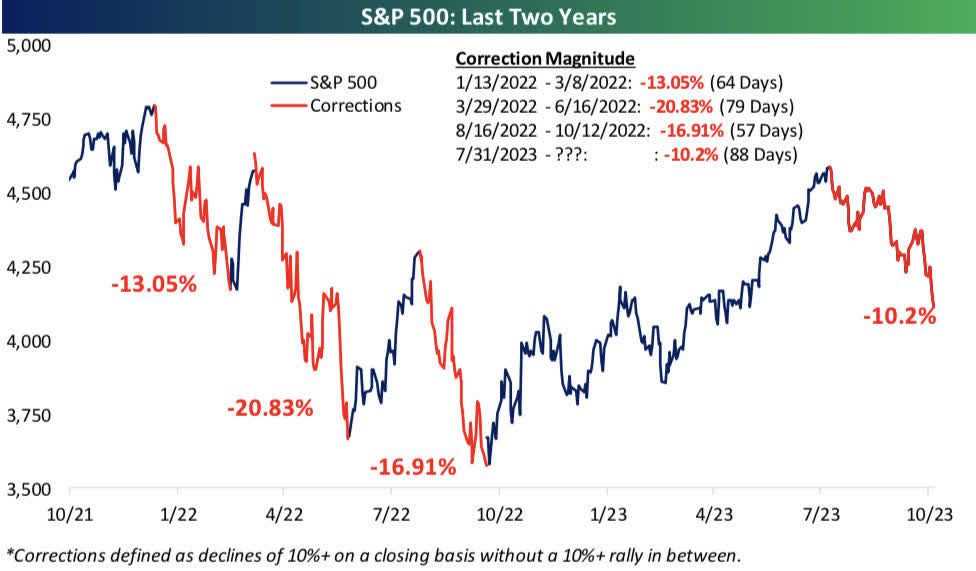
The three-month downtrend is intact. The S&P will need to rise above the prior high at 4,393.57 to call the downtrend into question. Bear market rallies are usually short, sharp affairs. Last week was a bear market rally until proven otherwise.
Uncertainty remains high and risk management is the priority.
Economic Indicators
The payrolls report was the big number last week. Nonfarm payrolls increased by 150,000 in October. It is a strong number. But it was short of economists’ estimates of a 180,000 gain. The preceding two months were adjusted down by 101,000 as well. Average hourly earnings rose by 4.1% year-over-year in October. Wage growth above 4% isn’t compatible with 2% inflation. It was a decline from the 4.3% pace in September though, so heading in the right direction.
The Employment Cost Index (ECI) rose 4.3% in the third quarter year-over-year. The ECI is a more comprehensive view of labor costs. The Fed pays attention to the ECI and the ECI is signaling a tight labor market. The UAW strike might have had a hand in the lower-than-expected jobs number. We’ll have to wait until next month to see.
Of course, most economic data only tells us where the economy has been. It doesn't give us much insight as to where it is going. That’s in good part because the data is subject to revision. The chart below highlights the problem. Each of the dates shows economic growth immediately before the start of a recession. In seven of the last ten recessions real GDP growth was 2% or more immediately before the start of the recession. There was thus no sign of a recession in the data yet one began the next month.
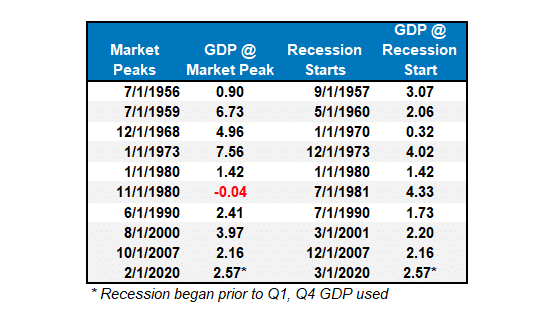
Norwood Economics expects a recession in the next few quarters. It is our base case with a 60% to 70% likelihood. That means that a recession will NOT occur 3 to 4 times out of ten. The second most likely scenario is two to three-quarters of no growth, call it a 20% to 30% chance. The least likely scenario is continued growth at or above trend.
The Ongoing Bear Market
Yep, Bear Market. The S&P 500 hit its all-time high on 4 January 2022. That’s 22 months ago. It has been flat over the last 28 months. We will remain in a bear market until the S&P rises above 4,818.62. The S&P is down 9.6% from its all-time high. And that’s after rising 5.9% last week. The Nasdaq is down around 10% from its all-time high and that’s after rising 6.6% last week.
Economic reports don’t help us predict where the economy is going. They only help us understand where it has been. Monetary policy does help us predict where the economy is going. The Fed has raised interest rates by 5.25% at the short end. The bond market has raised interest rates around 3% at the long end since the Fed started raising the funds rate. Interest is the price of money. It is an input cost for businesses. A higher price of money means businesses can’t borrow as much. It also means consumers can’t consume as much. It takes time for higher rates to work their way through the economy, but they always do eventually.
Quantitative Tightening (QT) is ongoing. It is monetary policy too. The Fed is shrinking its balance sheet which means it is shrinking the money supply. Lower supply increases the price of any good. It is no different with money. QT is running in the background. $60 billion per month in Treasuries and $35 billion per month in MBS are maturing. Maturing issues mean money flowing back to the Fed. That money is winking out of existence. The Fed has shed over $1 trillion in assets in a little over a year. Less money in the system means higher interest rates, all else equal. Monetary policy works. It just takes time.
The bear market in stocks will continue until well after the Fed has started cutting rates. Or at least that’s what history tells us. The yield curve is inverted because the Fed has raised rates at the short end. Banks don’t lend as much when the yield curve is inverted. They can’t make money borrowing at the short end and lending at the long end when short rates are higher than long rates. Tighter financial conditions lead to an economic slowdown and almost always recession.
The time from a yield curve inversion to recession has ranged from 11 to 22 months. October is the 18th month of curve inversion. We’ve had a recession 100% of the time when the three-month/10-year curve inverts, as it did last year. But recessions don’t start until after the yield curve re-steepens. Yield curve re-steepening has preceded the onset of past recessions with a lag of zero to nine months. The yield curve has begun to re-steepen.
Recessions also don’t start until after the Fed is done tightening. Since 1969 the pause time between the last Fed rate hike and first cut has been between zero and 14 months. In every case, recession began at or shortly after the first rate cut. The stock market didn’t bottom for between 13 and 33 months after the last Fed hike. The Fed’s last hike was July, three months ago.
Monetary policy works with long and variable lags. The result of Fed tightening is almost always recession.
Regards,
Christopher R Norwood, CFA
Chief Market Strategist