

Conference Board LEI and Inverted Yield Curve Signaling Recession

Market Update
The S&P 500 rose 1% to 4582.23 last week. The Nasdaq climbed 2%. The S&P is up 19% on the year. It is up 28% from its 52-week low on October 12th and hit a new 52-week high of 4,607.07 Thursday morning. The equal-weight S&P is up 9%. The gap between the equal-weight S&P 500 and the market-cap weighted S&P is large and likely to close. The two indexes move together over the long term.
Thursday and Friday’s activity suggests the S&P will trade down next week. The large gap up at the open on Thursday was sold aggressively by traders. The market peaked at 4,607.07 in the first 15 minutes of trading Thursday. It bottomed out at 4,528.56 late in the day. The 1.7% decline was almost a straight-down affair after an attempt to hold the line at 4,580 failed. The gap-up opening was likely caused by the stronger-than-expected advance Q2 GDP report. The S&P gapped up again on Friday but couldn’t mount a rally. It peaked at 4,590. Expect the 4,600 area to continue to provide resistance. Traders are likely to take profits if the rally continues to stall early next week. The risk is high of a short-term pullback. The 50-day moving average is at 4,370 and is a reasonable target. It would be a 5% pullback.
Small-cap stocks have underperformed for years. They are up around 13% YTD. The S&P is up 19%. Small caps are down 7% over the last two years. The S&P is up 3% over that period. Small caps are up around 30% over the last five years against a 60% gain for the S&P 500. Small companies usually grow faster than large companies. Small stocks are supposed to outperform large stocks because of the faster growth. That hasn’t been the case for a while now. It will change at some point and small companies will have their day in the sun.
The S&P 600 small cap index is trading at 15 times earnings. The S&P is trading at 19 times. BofA Securities wrote recently that small companies are 30% cheaper than usual relative to big ones. BofA expects small caps to earn an average of 11% a year versus 4% for large caps over the next decade. Small caps have underperformed by the most in two decades, according to Brad Neuman, director of market strategy at Alger. Neuman says small caps outperformed large caps by 50% over five years the last time that happened.
Consensus second-quarter earnings are now expected to fall 10.7%, according to Yardeni Research. A few weeks back the decline was forecast to be only a bit more than 8%. Earnings are now expected to be negative 0.3% for the year instead of up around 1%. The earnings picture is worsening yet the stock market continues to climb. Q4 estimates for earnings growth are 8.0%. The earnings estimate for 2024 is $244.59, or 12.5% higher than in 2023. Double-digit earnings growth with a large debt overhang and expensive money is a big ask for the S&P 500 companies. It will take accelerating revenue, widening margins, or both. Tightening monetary and fiscal policy makes that unlikely.
Meanwhile, in volatility land, the Russell 1000 Technology industry index is up 53.5% year-to-date as of July 17th. It was down 34.6% in 2022. The way the math works that only puts the index back to break even for the 18-month period. Lots of volatility but no profit isn’t what an investor wants. High volatility can bring high returns, but it can also bring big losses. The ARK Innovation ETF (ARKK) is up 54.5% YTD. It was down 67% in 2022 and 23.4% in 2021.
The large tech stocks that have led the charge in 2023 are likely to underperform over the next few years. The huge markup in 2023 makes it likely. The underperformance won't necessarily start tomorrow. The “Magnificent Seven” will likely begin trading sideways to down in the next few quarters. The Magnificent Seven is the name given to Apple, Tesla, Nvidia, Microsoft, Alphabet, Meta, and Amazon.
Expect a 5% to 10% correction at any time. Expect a recession in the next six to twelve months. Expect small to outperform large over the next five years.
Economic Indicators
Economic indicators last week were softer than expected in general. The notable exception was the Q2 GDP report. The S&P flash U.S. manufacturing PMI rose to 49.0 in July from 46.3. The S&P flash U.S. service PMI fell to 52.4 from 54.4 and below the expected 54.0. Numbers above 50 show expansion and below 50 contraction. Home prices continued to decline based on the S&P Case-Shiller index. New home sales fell to 697,000 from 715,000 and below expectations of 725,000.
The advanced GDP report clocked in at 2.4% above the 2.0% expected. The advance report is around 90% estimates. It can and usually is adjusted as data comes in. The adjustments can be large. It would not surprise me if Q2 GDP is adjusted down over the next few quarters. Personal income came in below expectations at 0.3% instead of 0.4%. Personal spending of 0.5% was as expected. Core PCE was 0.2% in June as expected. Core PCE year-over-year was 4.1% better than the expected 4.2%.
The Employment cost index for Q2 was 1.0%, better than the 1.1% expected. The ECI is the broadest measure of labor cost. The annualized rate fell to 4.6% from 5% in the first quarter. The Fed is concerned about wage labor growth above the 3.0% to 3.5% needed for inflation to fall to 2%. The ECI is heading in the right direction but slowly.
One could make a case for a soft landing. The economy is still strong, as is the labor market. The Wall Street narrative is increasingly trending along those lines. While a soft landing is possible, it is still a low-probability event.
A Soft Landing Imminent?
The economy is complex. It is dynamic. There are many feedback loops. Conditions are changing constantly. Humans are a part of the mix and humans learn. The capital markets are also complex and for the same reasons. The capital markets reflect the economy over the long run. There are frequent short-term deviations though.
Current economic data points to continued growth and falling inflation. The Atlanta Fed’s GDPNow tool is predicting 3.5% growth for Q3, higher than the 2.4% reported for Q2. Meanwhile, the trimmed mean PCE is 2.5% for one-month PCE inflation annualized. It is 4.2% for 12-month PCE inflation. The trend is heading the right way, if slowly. But that doesn’t mean we’ll stop in the soft-landing zone. A hard landing looks like a soft landing until it doesn't.
Many economic indicators are flashing recessionary signals, according to Jeffrey Sherman. Sherman is the deputy chief investment officer at asset manager DoubleLine. “The bond market is telling the Fed that it will have to cut rates,” said Sherman in a recent interview.
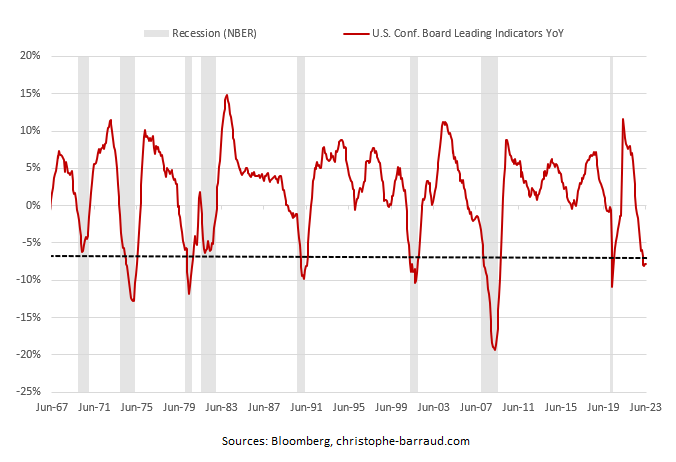
The US Conference Board Leading Economic Indicator (LEI) contracted in June for the 15th consecutive month. It hit a level that has correctly called eight previous recessions dating back to 1967. There have been no false positives. As well the NY Fed’s recession probability gauge has spiked to the highest in more than 40 years. Likewise, the 3M/10Yr yield curve inversion has a perfect track record of forecasting recessions with no false positives. The 3M/10Yr yield curve inverted in October 2022. Recessions followed between 6 and 15 months later.
The US economy may avoid recession. It is a complex system, dynamic and always changing. It’s possible the indicators that have predicted recessions in the past won’t work this time. Playing the odds though dictates playing defense at this point in the business cycle. Bear markets are a wonderful buying opportunity. You need cash or defensive positions to sell though. Otherwise, you can't buy those good companies going on sale. Risk management remains a priority.
Regards,
Christopher R Norwood, CFA
Chief Market Strategist


