

Debt, Fiscal Stimulus, and Inflation
Market Update
The S&P 500 lost 2.3% last week to finish at 4478.03. We predicted a down week in last week’s newsletter. We wrote, “Thursday's and Friday’s activity suggests the S&P will trade down next week." We also wrote that, “Traders are likely to take profits if the rally continues to stall early next week. The risk is high of a short-term pullback.”
And that is exactly what happened. The S&P traded sideways Monday and Tuesday. It gapped down at the open on Wednesday as profit-taking set in. Wednesday finished near the lows of the day. The S&P gapped down again on Thursday, hitting an early low of 4485 before starting to recover. The S&P pushed higher to 4540 by 1 p.m. on Friday only to have selling materialize again. The index sold off quickly to 4,474.55 late on Friday. The late downside action suggests that the market will trade down this week as well. The profit-taking doesn’t appear over yet. We wrote last week that the 50-day moving average was a reasonable downside target. It still is. The 50-day is at 4,400. We wouldn’t be surprised if we see a test of the 4,400 level sometime in the coming week. Resistance remains at 4,600.
The S&P started last week up 28% from its bear-market low in October. It has had the best first seven months since 1997. Some profit-taking is to be expected. Especially since sentiment has turned decidedly bullish. Individual investors’ equity allocation reached a 14-month high last month, according to the American Association of Individual Investors (AAII). Likewise, cash allocations decreased 1.8 percentage points to 18.0%. This is the smallest allocation to cash since April 2022. Cash allocations are below their historical average of 22.5% for the eighth consecutive month. Sentiment is a contrarian indicator when it hits extremes. Bullish sentiment and fear-of-missing-out (FOMO) are at levels that make a pullback likely. It may have already started.
A pullback does not mean the rally is over though. The economy continues to surprise with its resilience. Second quarter GDP was a better than expected 2.4%. The Atlanta Fed’s GDPNow forecast tool is predicting 3.9% for Q3 as of 1 August up from 3.5% on 28 July. Furthermore, the jobless rate fell back to 3.5% in July. It hasn’t been that low since 1969. Payrolls grew by 187,000 and hourly wages were up 4.4% year-over-year. Wage growth is rising at a 4.9% annual pace over the last three months. The job growth, unemployment level and wage growth all mean that the Fed may not be done raising rates. More rate hikes mean a higher likelihood of recession, but maybe not this year.
A growing number of economists are throwing in the towel on a recession in 2023. Bank of America and J.P. Morgan both canceled their recession calls for 2023 last week. A recession in 2024 is another matter. The CEO Confidence survey for the third quarter showed that 84% of Fortune 500 CEOs expect a U.S. recession over the next 12 to 18 months.
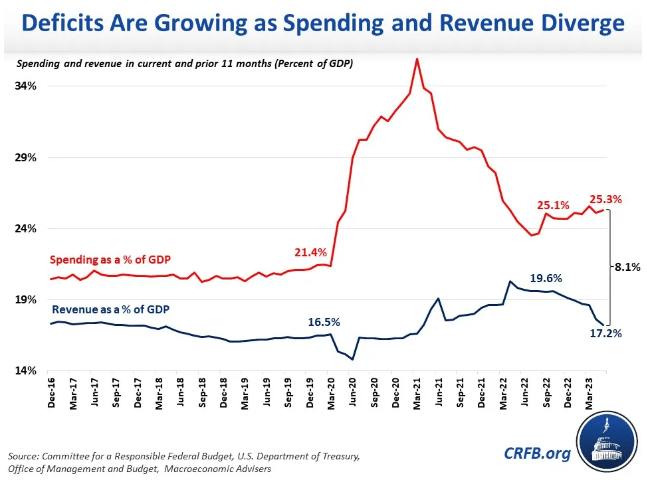
Offsetting a growing economy is an expensive market. The market is trading at 19x forward earnings. An already high earnings ratio makes it less likely the S&P will continue climbing. Earnings growth will have to meet and even exceed already lofty expectations. Double-digit earnings growth forecast for 2024 will need to materialize. Otherwise, the market may experience a serious sell-off in the next few quarters. The federal government's spending spree is one reason 2024 earnings may actually meet expectations. The federal deficit is running over $1 trillion for 2023, more than 6% of gross domestic product. Fiscal stimulus of that size will help keep the economy humming. It will also make it more difficult for inflation to continue falling.
A plausible base case is stalemate. On one side a steadily growing economy. On the other side an expensive stock market. A trading range market for the next few quarters would not come as a surprise.
Economic Indicators
U.S. manufacturing is still in recession. The S&P final manufacturing PMI was 49.0 in July, the same as in June. The ISM manufacturing index was 46.4% in July up from 46.0% in June. The ISM services index continued to show growth in services, coming in at 52.7%. It was down from 53.9% in June though.
The jobs market continues to show strength. The nonfarm payrolls grew by 187,000 up from 185,000 the prior month. Unemployment fell back to 55-year lows and hourly wages rose by 4.4%. Wages rose by 4.9% annually over the last three months. Job openings continued to indicate a tight jobs market with 9.58 million openings. That was down marginally from 9.62 million in June. The Fed will need to continue tightening if wage growth doesn’t slow to 3.0% - 3.5%. Either that or the Fed will need to give up on its 2.0% target and signal a willingness to allow inflation to run at 3% or more. Some commentators believe the Fed is preparing to shift its inflation target higher. Long-term Treasury yields will move higher if the Fed does raise its inflation target.
The Debt, Fiscal Stimulus, and Inflation
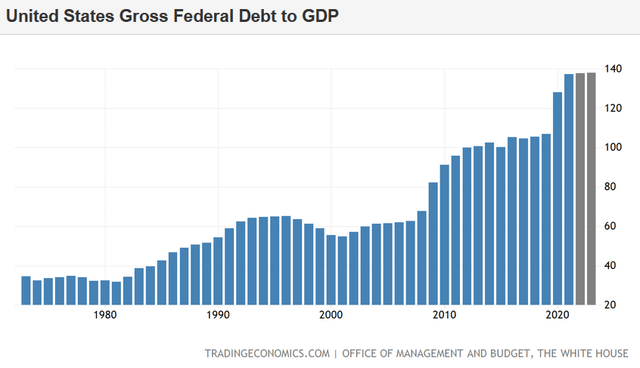
The federal government is running large deficits. It has been for most of the period since the Great Recession. The debt has ballooned to around $32.5 trillion. The debt was around $10 trillion in fiscal 2008. It was around $17 trillion in 2019. The economy is $23.5 trillion in 2023. Interest payments are skyrocketing. The government spent $476 billion on net interest payments in 2022. Interest payments grew by 35% from 2021 to 2022. The $476 billion in interest payments equals 2% of gross domestic product.
The Congressional Budget Office (CBO) estimates that the federal budget deficit will total $1.5 trillion in 2023. It will be about $160 billion larger than 2022. The deficit will be about 6.4% of gross domestic product (GDP) in 2023. Large deficits during expansions indicate a structural imbalance between revenues and expenses. Deficits are normal during recessions when taxes fall, and social benefits rise. Governments with structurally balanced budgets run surpluses during expansions. The U.S. has a debt problem. The debt is growing almost three times as fast as the economy. The trend is unsustainable.
That fact will become obvious in the next few years as the interest burden increases. The CBO is projecting net interest payments on the debt totaling $663 billion in 2023. It expects interest costs to almost double over the coming decade from $745 billion in 2024 to $1.4 trillion in 2033. Interest payments on the debt will be almost 5% of GDP by 2033, assuming 2% average GDP growth. The U.S. economy has averaged about 2% GDP growth since the Great Recession.
It is almost a certainty that inflation will be higher over the next decade than in the last. The U.S. government needs inflation to help it pay down the debt. Inflation reduces the real value of the debt. It is a tax on bond investors and savers in general. It is a transfer of wealth to debtors.
The U.S. is the largest debtor in the world, and it needs inflation. The U.S. has used inflation before to pay down debt. World War II left us with a pile of debt. Inflation was allowed to rise. Interest rates were held down through financial repression. (Financial repression is the use of various institutional arrangements to keep interest rates low for the government.)
Higher inflation and financial repression were successful in paring debt during the 1945-80 period, wrote Carmen Reinhart and M. Belen Sbrancia in an International Monetary Fund working paper in 2015. These tools might be deployed again to cope with the surge in public debt.
Bond investors will suffer if inflation runs higher than expected. The value of interest payments drops as inflation rises. Bond prices must fall, and interest rates rise to accommodate the higher inflation rate. Stocks will struggle as well. P/E multiples contract as inflation rises. Earnings are worth less as inflation reduces their real value. Growth stocks in particular are susceptible to rising interest rates, which go hand in hand with rising inflation.
Folks planning for retirement would do well to include higher rates of inflation in their assumptions. Spending goals will be at risk otherwise. The odds favor inflation averaging at least 3% over the next decade. An inflation rate of 4% or more isn't out of the question.
Forewarned is forearmed.
Regards,
Christopher R Norwood, CFA
Chief Market Strategist


