

- Volatility is rising in the stock market
- A recession is increasingly likely in the next six to twelve months
- Risk management means using Modern Portfolio Theory to reduce risk for any given level of return

S&P 500 10-day Chart
Market Update
The S&P 500 fell 0.04% to close the week at 5,344.16. It was a volatile week despite the index finishing within three points of its start. We wrote last week that, “The rapid changes in the odds in the futures market are unusual. It suggests that investors are unsure of themselves. The market hates uncertainty. Monday's open could be interesting.” Monday's opening was interesting as it turned out. The S&P 500 gapped down at the open. It lost 4.3% from Friday’s close to the Monday morning low, which came in the first 15 minutes of trading. The VIX spiked to 65 in pre-market trading. Any move above 35 in the VIX typically signals a bottom is imminent. That was the case Monday as the S&P bottomed in the first 15 minutes of trading.
Ignore claims that the stock market is responding to a weakening employment picture. Technicals are dominating daily market moves. Two Fridays ago, the S&P bounced off the 100-day moving average. Last Monday the gap down cleared support at the 100-day moving average which is at 5,300. Traders positioned to benefit from a decline were hoping for a run lower to the 200-day at 5,025. They may still get it, but it didn’t happen last week. Buyers came in early Monday. The S&P peaked above the 100-day during trading on Tuesday before closing below it. The S&P finally regained the 100-day, closing above it on Friday. There is resistance at 5,400 and 5,440. The 5,440 resistance is where the 20-day moving average recently crossed below the 50-day.
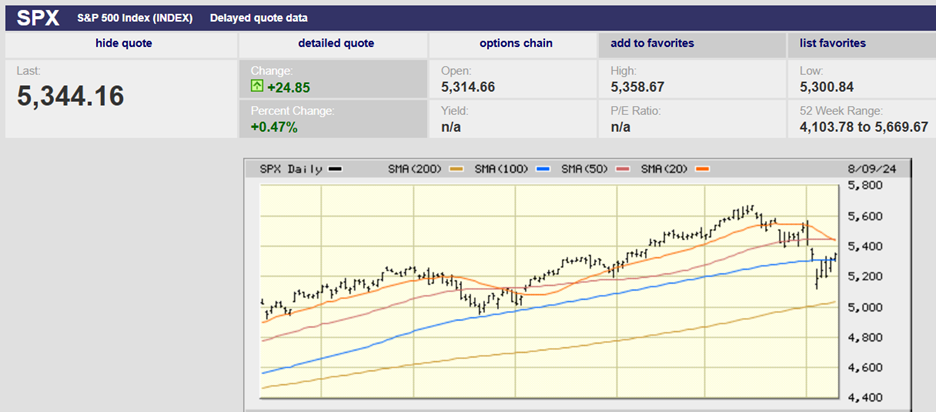
S&P 500 Six Month Chart
The 20-day moving average falling below the 50-day is a short-term negative. Traders will favor the downside because of the cross. It increases the chances that we’ll see more downside testing in the next few weeks. A fall to the 200-day moving average wouldn't be a surprise.
The S&P 500 and the Nasdaq Composite recorded their largest three-day percentage declines in more than two years by Monday's close. The S&P fell 6.1%. The Nasdaq fell 8%. The first two trading days of August were already the worst start to a month for the S&P 500 since 2011. It was the worst start for a month for the Nasdaq since 2008. The selling two Fridays ago and Monday are red flags. The stock market spent the rest of the week recovering, but investors should take heed. The bounce from last Monday’s low might be short lived. The decline wasn’t big enough or long enough to reset the bull market advance, at least not for long. Investors should expect more volatility during the rest of August and into the fall.
Norwood Economics is on recession watch. That doesn’t mean we are avoiding buying. There are always good companies on sale. Sometimes it’s just harder to find them. The S&P 500 is expensive on a capitalization weighted basis. The S&P is trading at 21 times 12-month forward earnings. Yet the equal weighted S&P is only trading at 18 times 2024 earnings. The S&P 500 has traded at 16 times earnings over the long run. There are good S&P 500 companies trading at 10x to 12x earnings. Investors just have to find them.
Valuations for small and midsize stocks are more reasonable as well. The S&P SmallCap 600 and Midcap 400 trade for 16 times 2024 earnings estimates. Wall Street is expecting small stocks to perform well once the Fed starts cutting. It's a reasonable expectation, if the economy avoids recession. Small caps will fall along with the rest of the market if the economy falls into recession. Wall Street is also expecting value stocks and dividend paying stocks to outperform growth once the Fed starts to cut rates.
The next few quarters are likely to see continued volatility. A bear market is likely in the next six to twelve months because a recession is likely. We won’t get out of the stock market because of the forecast though. Forecasts are for context, which helps to manage risk. Forecasts are not for market timing, at least not at Norwood Economics.
Charts to Ponder
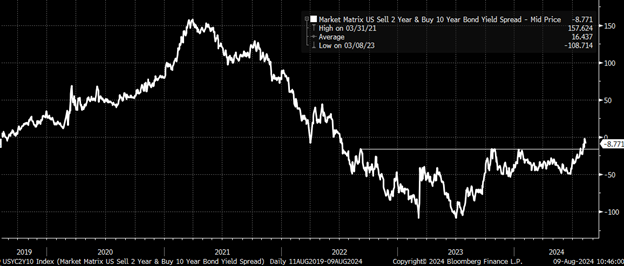
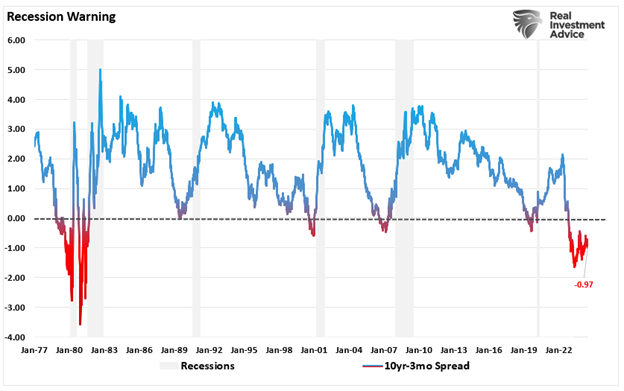
“The bond market is sending a clear warning message that's hard to miss. This message came last week following the weaker-than-expected job report. It led to a big break-out in the yield curve, crossing above -15bps for the first time since the summer of 2022.” Mott Capital. A yield curve inversion occurs when the Fed goes on a rate hiking campaign. Inverted yield curves are a warning that a recession is on the horizon. Steepening yield curves following an inversion signal the recession is imminent.
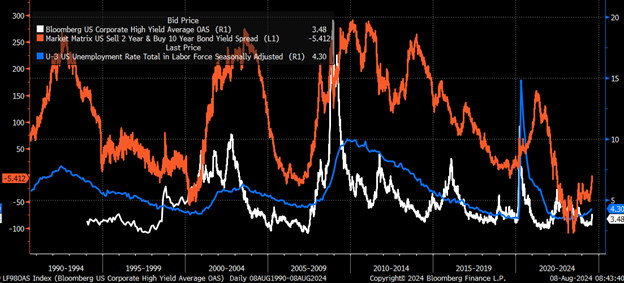
“Additionally, the jobs report last week did something significant: It led to the yield curve breaking out and finally pushing higher. This was a critical development because, historically, a steepening yield curve (red line in the above chart) is accompanied by rising unemployment rates (blue line). A rising unemployment rate and a steeper yield curve typically see high-yield credit spreads widen (white line).” Mott Capital
A steepening yield curve occurs when the Federal Reserve begins to cut the funds rate. The Fed cuts the funds rate in response to a weakening jobs market. A weakening jobs market accompanies a recession. Recessions lead to reduced corporate earnings growth and a falling stock market. They also lead to widening credit spreads as banks curtail lending to their riskiest corporate clients.
Some Charts that suggest a recession is near
Inverted yield curves lead to recessions.
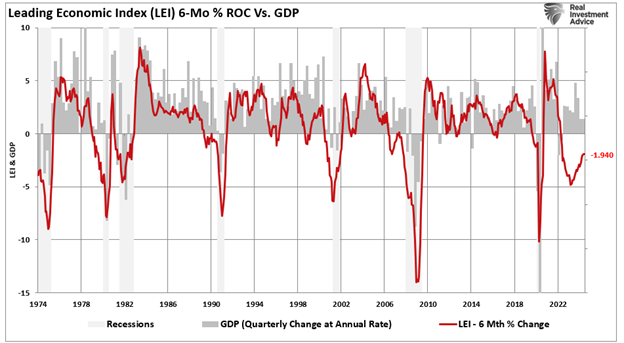
The Conference Board’s Leading Economic Index (LEI) is a reliable recession indicator.
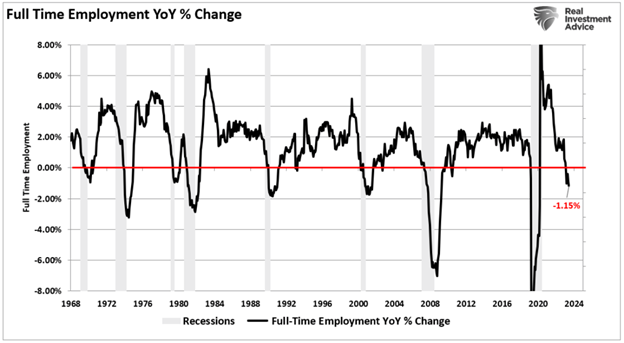
Falling full time employment means less consumer spending, which often leads to a recession.
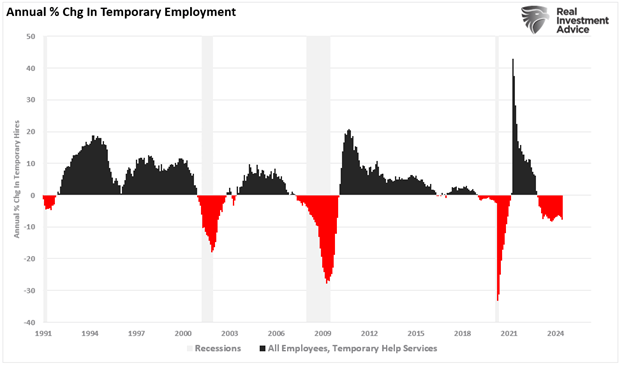
Falling temporary employment is also a sign of a weakening labor market.
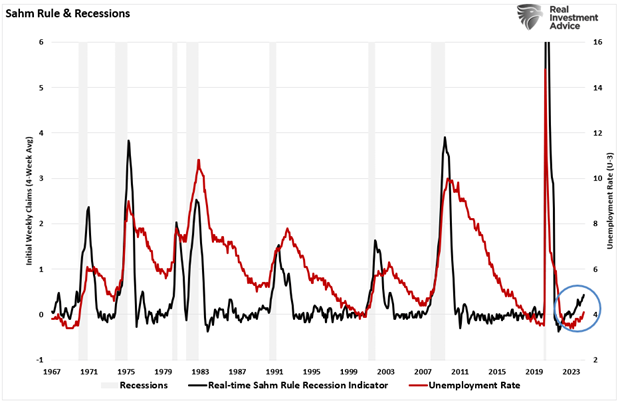
The Sahm rule has been triggered. It is an accurate predictor of recession. Economist Claudia Sahm developed the “Sahm Rule,” which states that the economy is in recession when the unemployment rate’s three-month average is a half percentage point above its 12-month low.
Risk management is a priority as the economy weakens, unemployment rises, and corporate earnings growth slows.
Modern Portfolio Theory, Harry Markowitz, and Mean Variance Efficient
Portfolios
I had a long talk about risk with a friend last week. We covered a lot of ground. I frequently talk with clients about risk. Understanding how much risk you’re taking with your investment portfolio is important. It’s also difficult. In fact, most investors have a poor understanding of risk and how to manage it. Modern portfolio theory can help.
Modern portfolio theory has been around for a while. Harry Markowitz is the U.S. economist who created Modern Portfolio Theory in 1952. It fundamentally changed the way that people and institutions invest. The theory shows how portfolio management can reduce risk. The theory states that, given a desired level of risk, an investor can optimize the expected returns of a portfolio through diversification.
Markowitz's contribution extended to making the distinction between the risk of an individual stock and the risk of a portfolio. He showed how individual risky stocks can be combined to produce a less risky portfolio. The key is picking stocks with returns that have a low correlation to one another. At its heart, modern portfolio theory makes two key arguments. The first is that a portfolio's total risk and return profile is more important than the risk/return profile of any individual investment. The second is that investors can build a diversified portfolio that produces the highest rate of return for any given level of risk.
Norwood Economics builds diversified portfolios for its clients. The portfolios include stocks, both domestic and international, bonds, real estate, and gold. We build diversified portfolios to increase our clients’ risk adjusted returns. Our portfolios will lag when stocks are rallying. They should and usually do outperform when the stock market is falling. Risk-adjusted return is the benchmark. Our goal is to generate excess risk-adjusted return for our clients over the long run.
Regards,
Christopher R Norwood, CFA
Chief Market Strategist


