

- Ignore the Noise, Ignore the Frenzy
- Federal Reserve Now Expected to Cut Funds Rate by at least 1% by Year-end
- Jobs Report Wasn't that Bad

Market Update
The S&P 500 lost 2.1% last week and closed at 5,346.56. The 50-day moving average gave way again Friday but the 100-day moving average held. The index bounced off the 100-day in early trading Friday. It retested the 100-day in the afternoon, holding again. The 100-day is around 5,300. The S&P’s low Friday was 5,302.02 reached at 11 am. Treasury yields fell sharply on Friday on the weaker-than-expected jobs report. The two-year Treasury yield plunged 22 basis points to 3.92%, breaking below 4% for the first time since May 2023. The 10-year Treasury yield fell to 3.79%, marking its lowest level since December 28, 2023.
Investors reacted to the weak jobs report by sharply increasing the probability of a half-point cut in the Fed funds rate at the September meeting. The CME FedWatch tool had the half-point cut probability at 74.0% by Friday afternoon. It had the likelihood of at least a quarter-point cut at 100% by the end of the day Friday. Investors decided by Saturday morning that they had overreacted. They'd dropped the likelihood of a half-point cut to 22% by Saturday morning. The futures market now has the probability of a 0.25% cut in September at 78.0% with a 22.0% chance of a half-point cut. What’s more, the futures market is now pricing in over a 96.7% chance that the fed funds rate will be 4.5% to 4.75% or lower by year-end.
The September CME FedWatch tool Chart is below
(Sunday afternoon sees the odds of a half-point cut back up to 80%. The odds of a quarter-point cut have settled at 20%. The rapid changes in the odds in the futures market are unusual. It suggests that investors are unsure of themselves. The market hates uncertainty. Monday's open could be interesting.)
The December CME FedWatch Tool Chart is below.
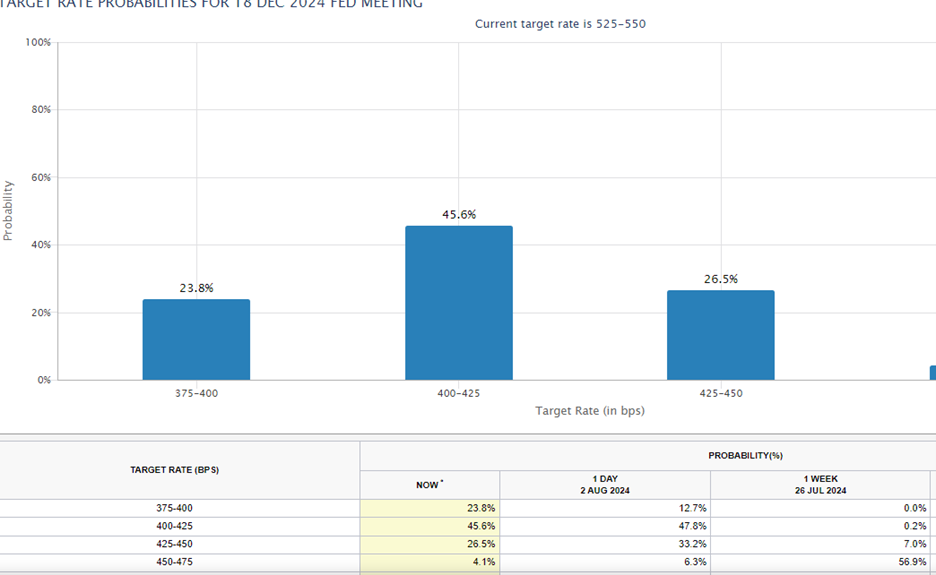
“One wonders what will be happening to the economy and unemployment in the next few months to warrant a 0.75% drop in the funds rate,” we wrote last week. The answer seems to be that investors are suddenly expecting a sharp slowdown in the economy. The consensus had been for a soft landing before the jobs report on Friday. The CME FedWatch tool on Sunday afternoon is predicting that the funds rate will be at least a full point lower by year-end. The futures market is showing a 23.8% chance of a 1.50% cut in the funds rate by year-end as of Sunday afternoon. A drop to 3.75% - 4.00% by year-end is more appropriate for a hard landing. Again, Monday could be an interesting day in the stock market.
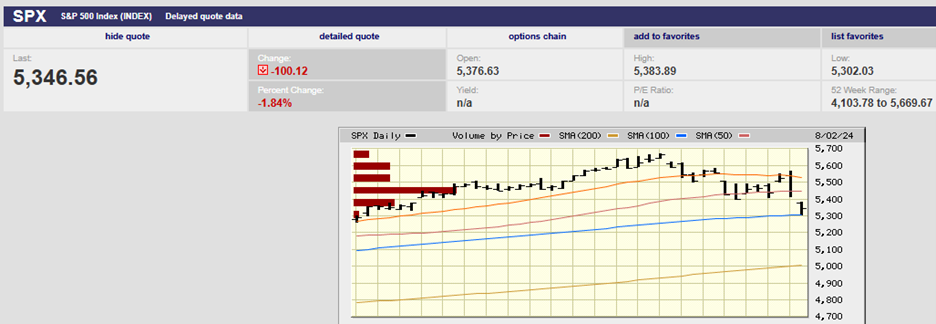
S&P 500 2-month
A battle around the S&P 500’s 50-day moving average raged for five trading days in a row, beginning Wednesday the 24th. (See the above chart). The opening salvo was a close below the 50-day moving average on the 24th. It was the first close below the 50-day MA since early May. The next four trading days saw the index on either side of the 50-day. Traders attempted to break the market higher on Wednesday, despite a weak ADP employment number. There was a gap-up opening that ran the S&P to the 20-day moving average. We wrote last week that, “The S&P 500 closed above its 50-day moving average on Friday. The low Friday (found support) at the 50-day. We should see a bounce in the coming week. More selling is likely around the 20-day moving average, which is at 5,550. The short-term trend is down. Traders might test Thursday’s low of 5,390.95 in the next few weeks.”
That’s exactly what happened, except the test of 5,390.95 came quickly. The S&P traded flat the first two days of the week before bouncing on Wednesday. The high Wednesday was 5,551.51, a bit above the 20-day and right where we expected to see resistance. Traders couldn’t maintain the break above the 20-day though, with the market falling back below by day end. Thursday saw a gap up open that again penetrated the 20-day, this time reaching 5,566.16. It was a blatant attempt to clear the 20-day at the market open and start a short covering rally. A short covering rally would take the index higher. Traders positioned on the long side would profit. The advance was met with heavy selling though. The S&P high to low on Thursday was 2.8%, a big swing. What’s more it was an early high in the first 30 minutes of trading and a late low at 2:45 pm. Remember, the public tends to trade in the morning and the pros in the afternoon.
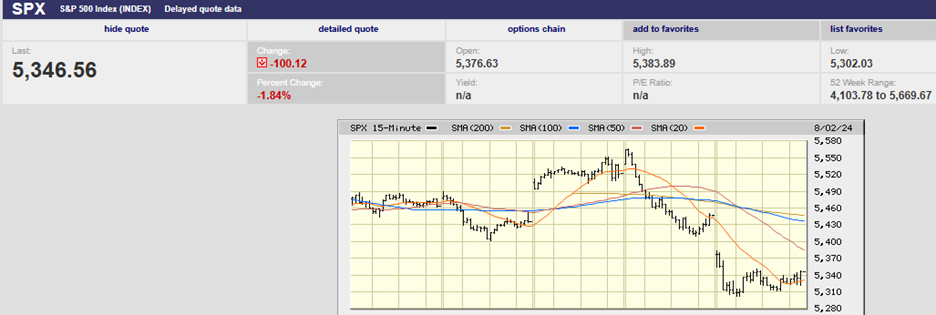
S&P 500 5-day
Friday’s gap-down opening was blamed on a statistically insignificant miss in the jobs number. It’s more likely that the gap down was a continuation of Thursday’s selling. The S&P was sitting on the 50-day again by Thursday’s close. Traders with short positions were able to break support at the 50-day. The break below then triggered stop losses that sent the S&P even lower. Shorts make money when the market falls.
A failed break above the 20-day and reversal Thursday screamed for a test of the downside Friday. The jobs number was an excuse. It was only Wednesday that the weaker-than-expected ADP employment number was met with a gap up market open. Investors ignored the weaker ADP employment number on Wednesday. They supposedly responded poorly to the BLS number on Friday. Seems inconsistent. It is more likely that technical trading was responsible for the bloody Friday given the sharp early reversal in the S&P on Thursday. The algorithms were ready to sell at the open Friday morning regardless of the news.
The VIX spiked to 29.66 on Friday but closed at 23.39. The VIX will need to rise to the mid-30s before a sustainable bottom in the S&P is in place.
We can expect a bounce early next week that will likely fail. The short-term trend is still down. The 5,302.02 Friday low will likely be tested sooner rather than later. We could see a test on Monday.
Economic Indicators
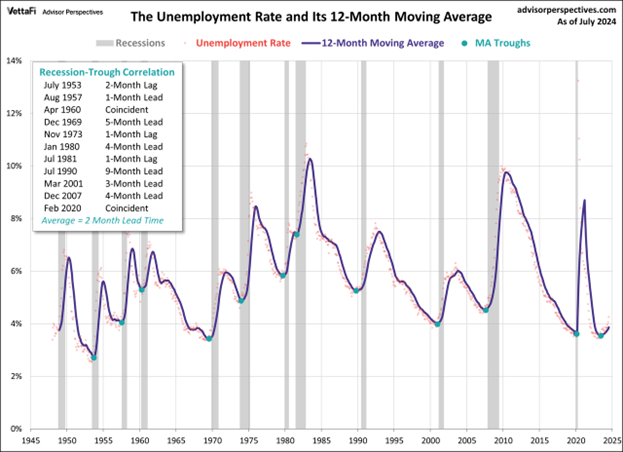
Last week’s economic news was dominated by the jobs report. It was weaker than expected. The U.S. economy created 114,000 jobs in July, a strong number. But well below the 179,000 created the prior month and the consensus estimate of 185,000. The U.S. unemployment rate rose to 4.3% from 4.1% the prior month. The unemployment number is at its highest since October 2021. It is still low though.
The Case-Shiller price index rose 6.8% in May, slower than the 7.3% rise in April. Home prices are at new highs. Mortgage rates are around 7%. Home affordability is low. Housing is a primary conduit for Federal Reserve monetary policy. The housing market is struggling.
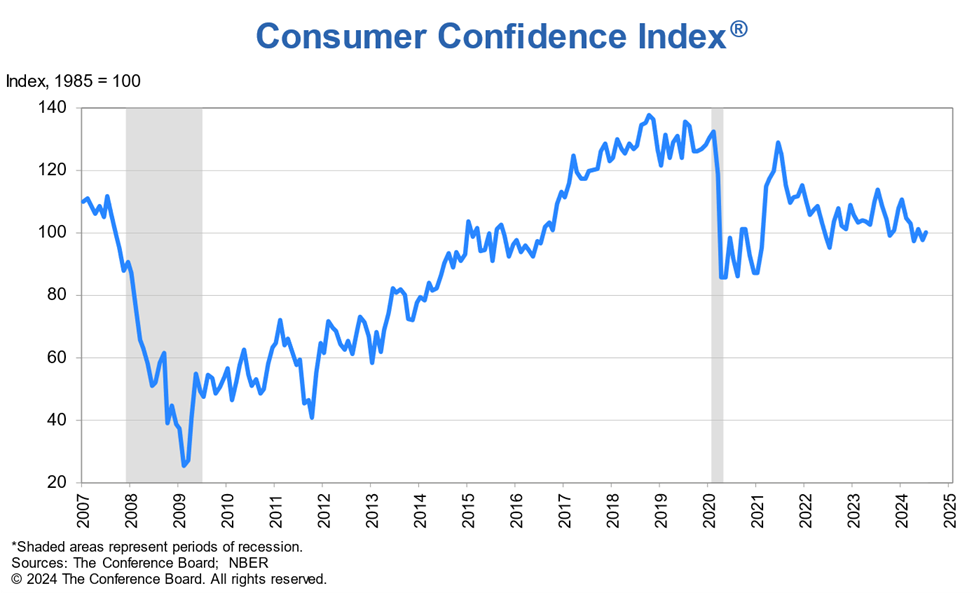
The Consumer Conference Board’s consumer confidence index rose to 100.3 in July, up from 97.8 the prior month. Although consumer confidence rose, the Present Situation Index (PSI) declined. The PSI is based on consumers’ assessment of current business and labor market conditions. “Confidence increased in July, but not enough to break free of the narrow range that has prevailed over the past two years,” said Dana Peterson, Chief Economist at the Board.
Wednesday’s ADP employment report clocked in at 122,000, below the expected 150,000 and below last month’s 155,000. It was the smallest gain in six months and pointed to a weaker labor market, reported Jeffry Bartash of MarketWatch. The employment cost index came out Wednesday as well. It rose 0.9% in Q2, down from 1.2% the prior quarter. “With wage growth abating, the labor market is playing along with the Federal Reserve’s effort to slow inflation,” said Nela Richardson, chief economist at ADP. As noted earlier, the S&P 500 gapped up at the open following the weak ADP report.
Thursday saw more economic reports pointing to a weakening economy. The ISM manufacturing index fell to 46.8% in July from 48.5% in June. It was the fourth consecutive month in a row of declines and represented an eight-month low. The fall indicates an ongoing slump in the industrial side of the economy. Numbers below 50% signal the manufacturing sector is shrinking. Meanwhile the weekly initial jobless claims number rose to 249,000 last week from 235,000 the prior week. It was close to a one-year high. Hurricane Beryl and planned auto-plant shutdowns impacted the claims number.
Last week saw evidence that the economy is continuing to slow. The consensus has been for a soft landing. Economists and investors may be revising their thinking on the benign soft-landing scenario. There seems to be a growing concern that the U.S. economy will experience a hard landing.
Norwood Economics has been forecasting a recession in late 2024/early 2025 for a few months now. Last week’s economic data would seem to support our forecast.
Ignoring the Noise
Investors were fixated on employment last week. There was other economic news out, but it received scant attention from the media by comparison. The focus was the jobs report on Friday.
The reaction to the statistical insignificant miss is a good example of how Wall Street overreacts to a single data point. A cynic might believe that Wall Street purposely "overreacts" because it wants to spur investors to action. Volatility and trading volume mean profits for the big Wall Street players. The challenge for investors is to avoid getting caught up in the hullabaloo. Ignore the noise, ignore the frenzy.
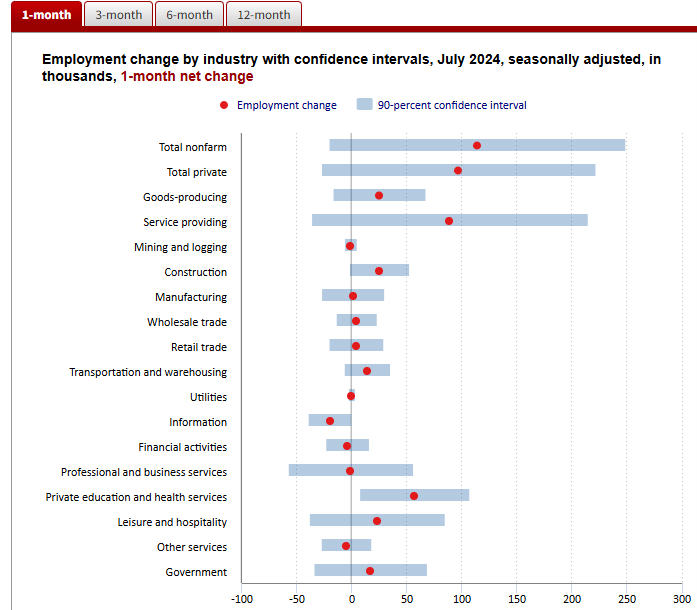
The jobs number came in at 114,000, below the 185,000-consensus estimate. It was also below the 179,000 number the prior month. Importantly, the 90% confidence interval was negative 20,400 to positive 248,400. The consensus forecast of 185,000 was well within the confidence interval.
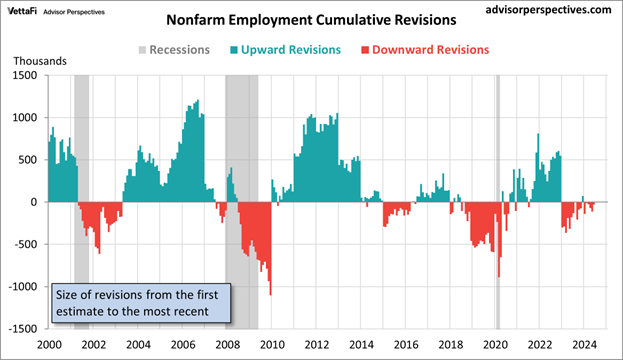
The payroll numbers have a first and second revision. The revisions can be large. Sometimes revisions come years later.
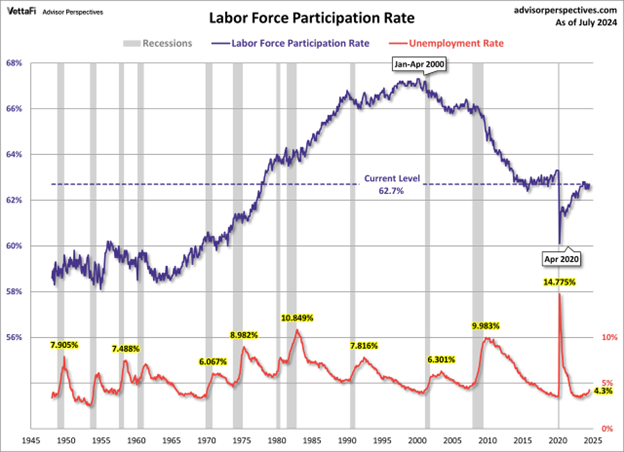
And the unemployment number isn’t necessarily signaling weakness. Unemployment is rising now in part because the labor force participation rate is rising. One possible reason for a rising labor force participation rate is that people are encouraged by a strong jobs market to re-enter the work force.
Yet Wall Street was in a frenzy on Friday because the initial estimate for jobs growth in July was 114,000 instead of the forecast 185,000. Here are some of the reactions:
- Commentators on Bloomberg were urging the Fed to cut rates immediately to stave off recession.
- The futures market ping-ponged the odds of a half-point cut from 11.5% before the report to 74% immediately after the report to 22.0% the day after the report. As of Sunday, it sits at 80%.
- Citi and J.P. Morgan announced their expectation of a half-percentage point rate cut at both the Fed’s September and November meetings. Their strategists believe a full 1.0% drop by the November meeting is necessary to ward off recession.
- “We say ‘sell the 1st cut’ as “hard landing" risks … [are] clearly rising,” at a time when most fund managers foresee a soft or no landing for the world’s largest economy, wrote BofA investment strategist Michael Hartnett Friday.
- A professor of economics at Duke University claimed the Fed was way behind the curve in an interview on Bloomberg. He predicted disaster if the Fed didn’t cut immediately rather than waiting until September's meeting.
And so, it went on Friday based on a single jobs number of questionable accuracy. Ignore the noise and the knee-jerk reactions of the pundits. It’s almost always better to keep doing what you’re doing rather than reacting to any one bit of economic news.
Norwood Economics will continue to buy good companies on sale regardless.
Regards,
Christopher R Norwood, CFA
Chief Market Strategist


