

- The Rotation into Small-Caps Continued Last Week
- Short-Term Market Movements are Mostly Noise
- Bonds Have Been a Poor Investment Over the Last 10 years
- Around 150 Companies Report Earnings this Week
Market Update
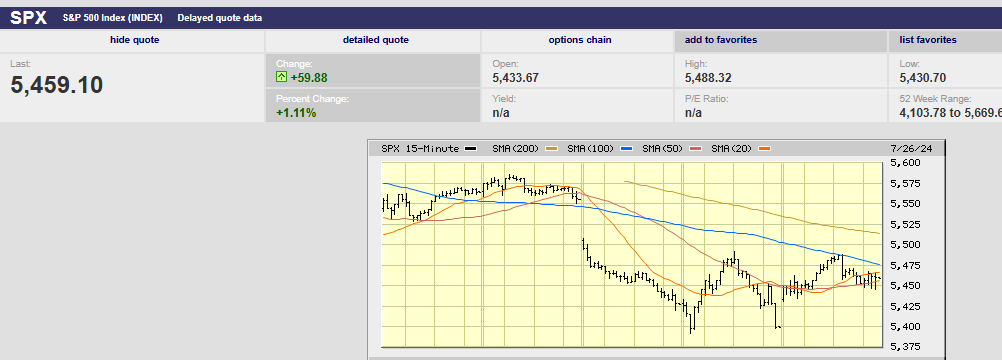
The S&P 500 fell 0.8% last week to close at 5,459.1. The IWM ETF (Russell 2,000) finished up on the week, rising 3.4% as small caps continue to outperform. The rotation out of big tech and into small caps has lasted 12 trading days so far. It began on 10 July. The S&P is down 2.1% over that period. The Nasdaq is down 7%. The Russell 2,000 has risen 11.3% since the 10th. It started July up 1% on the year. It’s now up 11%. A big move in a short time.
5-day S&P
The two-year Treasury yield finished the week at 4.45% while the 10-year yield finished at 4.19%. The two-year yield should continue to fall. It is almost a certainty that the Fed will begin cutting in September. The CME FedWatch tool is showing a 99.7% chance of at least one cut by September. In fact, futures traders are pricing in several cuts by year-end. The CME FedWatch tool is showing a 56.9% chance of the funds rate dropping to 4.5% - 4.75% by December. The funds rate is currently 5.25% to 5.50%. The inflation news only met expectations last week. The core PCE number rose from 0.1% to 0.2%. Still, the narrative is that the inflation report was better than expected. One wonders what economic news will warrant a 0.75% drop in the funds rate by year-end.
The market reached a high of 5,585.34 around 11:15 Tuesday morning. It drifted lower throughout the rest of the day, closing at 5,555.74. The index opened near 5,505 Wednesday morning, already down around 1%. The opening print was close to the market close the previous Friday. The S&P peaked at 5,508.04 in the first 15 minutes of trading Wednesday. It didn’t bottom until Thursday morning. The total decline from Tuesday’s close to the Thursday low was 3%. The Nasdaq lost 5.9% during that period. The Russell 2,000 lost 3.4%. The small cap index put in its low Wednesday. It started recovering before the S&P and Nasdaq, a sign of strength.
All the S&P 500 damage was done on Wednesday last week. There was no economic or other fundamental news to explain the sell-off. Although that didn’t stop pundits from pointing the finger at one thing or another. Some claimed the sell off was the result of a more uncertain election result. Others blamed soft earnings reports. Still, others blamed a strengthening Yen. (More on that later).
The rotation out of mega-caps and into small-caps continued last week. Investors are rotating into the more economically sensitive small caps. The thinking is that the Fed is going to cut several times by year-end. Lower interest rates will help economically sensitive stocks more. And small-cap stocks are more economically sensitive than large-cap. There is also talk of short covering in small-cap stocks. One trade is to sell the small caps short and use the proceeds to buy large caps. The goal is to capture the difference in performance. The trade may be unwinding. The reason for the surge in small caps matters as it speaks to duration. Short covering won't last long. Small-cap stocks would then give up their gains.
The rotation into small caps might also be a more durable move. A growing number of professional money managers have been talking about a coming rotation. It might be here. Their reasoning centers around valuation. The European continent’s Stoxx 600 index trades at an average price/earnings ratio of 15. The S&P 500 trades at 21x earnings. The S&P 600 small cap index trades at about 15 times expected earnings, almost 30% below the S&P 500’s 21x times. That’s close to the widest gap since at least 2010, according to 22V Research.
My brother often scratches his head at the reasons given for short-term market moves. I’ve told him that most short-term movements have nothing to do with fundamentals. It’s noise. The noise is created by trading, which is very different from investing. Most daily volume is from algorithms executing trading programs. Sometimes moves in the stock market are triggered by other markets. The bond market is large. The futures market is immense. So is the currency market. It’s often the case that the stock market is the tail, and another market is the dog. For instance, it's possible the stock market fell on Wednesday because of trades unwinding in the Fx market.
Here's what Michael Kramer of Mott Capital Management thinks might have happened Wednesday. Kramer wrote earlier this week that “Stocks collapsed (Wednesday) due to changing expectations around global monetary policies impacting currency markets and rates.” He went on to write that, “Yesterday’s big sell-off in equities appeared to stem from the rapidly strengthening yen, which sent a shockwave, causing a rapid shift in volatility. This unwind is likely only the beginning if the BOJ (Bank of Japan) is on the verge of shifting monetary policy next week, while the US market is pricing in a Fed rate cut in September.”
We are talking about the Yen carry trade. Borrow low-yielding Yen and exchange the Yen for higher-yielding dollars. Take the dollars bought and buy whatever you think is going to go up in the US stock market. Kramer writes that, “It is possible that one form of carry trade was to sell yen and use the dollars purchased to buy the basket of mega-cap stocks.” Kramer goes on to suggest that the yen unwind is likely closer to its beginning than its end. He bases this opinion on the rising cost of the carry trade. The trade becomes less profitable as the yield on Yen rises (borrowing becomes more expensive). Rising interest rates in Japan mean the yen will strengthen against the dollar, especially if the Fed does start cutting rates.
A rising cost of carry means traders unwinding the trade. In this case, it means selling the Magnificent Seven and exchanging the dollars for yen. So, if Kramer is right and this is the beginning of a carry trade unwind, it means there is more downside for the Magnificent Seven (or other dollar assets bought with the proceeds from shorting the Yen. Carry trades can be immense. Traders using leverage and piling into a popular trade can cause big volatility during the unwind. Especially if everyone is trying to exit at the same time.
Two charts support Kramer’s possible explanation for Wednesday’s ugly market. The first chart shows the relationship between the Yen exchange rate in white and the 10-year JGB/Dollar bond spread in gold. One can see that the Yen is trading with changes in the spread.

The second chart shows that the Yen exchange rate and the Bloomberg Magnificent 7 Index have been rising together.

The chart suggests that at least some traders have been using the FX market to fund leveraged bets on a basket of US mega-cap stocks. Kramer’s explanation of what triggered Wednesday’s selling is at least as likely as all the other reasons given by market strategists. Bonds, Forex, and Futures markets are huge and intertwined. Leverage is high given all the liquidity in the financial markets. Volatile moves in the stock market can occur because of activity in another market. It can leave one scratching their head.
The S&P 500 closed above its 50-day moving average on Friday. We should see a bounce in the coming week. More selling is likely around the 20-day moving average, which is at 5,550. The short-term trend is down. Traders might test Thursday’s low of 5,390.95 in the next few weeks. Or we might see a new all-time high if earnings reports beat expectations. Earnings season is in full swing. More than 150 companies will announce earnings this week. They include Microsoft, Meta Platforms, Amazon, and Apple. Disappointing guidance could send the market down to 5,250. That’s Rich Ross’s target. Ross is head of technical analysis at Evercore ISI target.
It should be an interesting next few months. Risk is high and risk management continues to be the priority.
Economic Indicators
Second quarter GDP was stronger than expected. The Q2 number was 2.8%. The consensus was 2.1%. First quarter GDP growth was 1.4%. The S&P flash US services PMI was stronger than expected in July, coming in at 56.0 versus 55.3 the prior month. The flash US manufacturing index was weaker than expected at 49.5 versus 51.6 the prior month. Anything below 50 indicates contraction.
Existing home sales and new home sales for June were weaker than expected. Initial jobless claims were 235,000, which met expectations. Core PCE met expectations, rising 0.2% in June and 2.6% year-over-year. The year-over-year reading was unchanged from the prior month. The monthly change rose from 0.1% in May. Consumer sentiment is stuck at an 8-year low. The survey number has fallen four months in a row. The University of Michigan sentiment number for July came in at 66.4.
The economic data out last week provided little evidence for a rate cut. The Atlanta Fed GDPNow tool is forecasting third-quarter GDP at 2.8%. The GDPNow tool isn’t all that accurate this far in advance of the report. Still, it does give one pause when considering a rate cut. The economy is growing by more than 2.5% with unemployment at a low 4.1%. Yet the futures market now has the Fed cutting rates by 0.75% by year-end. Either the economy will weaken rapidly into year-end, or the Fed won’t cut rates as much as investors expect. It’s hard to imagine 2.5% or greater GDP growth and a Fed in a full-blown easing cycle. It's even harder to imagine with the six-month trimmed mean PCE inflation rate at 3.2%, well above the 12-month number of 2.8%.
Data Mining
Bank of America’s Ohsung Kwon has tried to identify when the equal-weight S&P is likely to outperform the S&P 500. He found that it did so 90% of the time when the yield on the 10-year Treasury fell a full point from its 12-month high and the ISM’s manufacturing purchasing managers index rose over four points from its lows, according to Barron’s. Data mining can be dangerous. Building models and making investments based on past relationships often doesn't work. That's because the analyst is fitting the model to the past. Add a variable, delete a variable until you get a model that would have done well over some past period. It doesn't mean the model will work in the future. Relationships change. Correlation is not causation. Quantitative models tend to blow up when past conditions no longer apply.
Death of the 60/40 portfolio
The 60/40 stock/bond portfolio has been the go-to portfolio for many investors over the last forty years. Four decades of falling interest rates and inflation meant bonds provided a significant contribution to a balanced portfolio, 2022 excluded. The days of falling interest rates and inflation are long gone. Traditional conservative policies don’t exist anymore. The Republican party is no longer the party of fiscal restraint. Interest rates and inflation will be higher in the coming decades because of our huge and growing debt.

Deficits are huge and growing. Treasury bond buyers are already demanding higher yields to compensate for the risk of massive budget deficits, according to Ian Lyngen, head of U.S. rates strategy at BMO Capital Markets. There was a time in the early 1980s when bonds were known as certificates of confiscation. Why? Because bond investors lost money throughout the inflationary 70's and early 80's. Bonds are trending that way again already. The iShares Core US Aggregate Bond ETF (AGG) has lost 2.79% annually over the last three years. It has earned 0.04% annually over the last five years. It has earned 1.45% annually over the last ten years. Not much help to a 60/40 portfolio.
High debt levels lead to inflation when countries can print more money to pay their debt. The U.S. debt is dollar debt. It won’t default but will print to help pay down the mountain of debt accumulated since the Great Recession. The 60/40 portfolio isn’t likely to be the stalwart portfolio it once was because bonds won’t earn what they’ve earned in the past.
One More Chart on Investor Bullishness

Lance Roberts points out that investors are fully allocated to equities. The chart above shows the average equity allocation of both retail and professional investors. “Historically, readings above 80 are associated with near-market peaks. The current reading is 87, which is in more rarefied air,” he writes in a recent note.
The next few months could see a 10% to 15% pullback given the bullishness among investors.
Regards,
Christopher R Norwood, CFA
Chief Market Strategist


