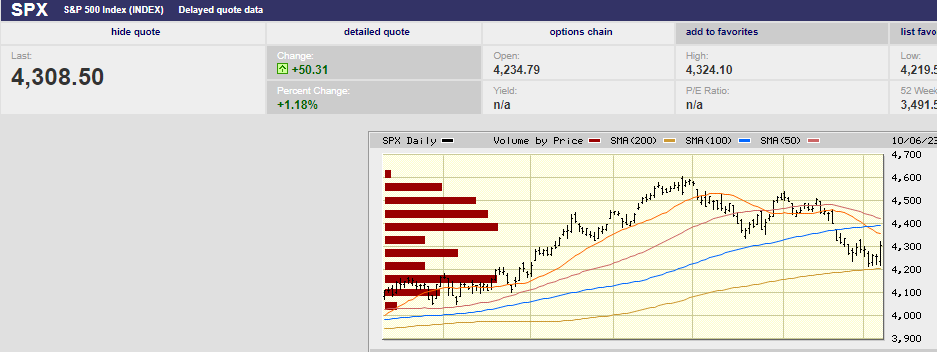
The 200-day moving average is support for now.
Market Update
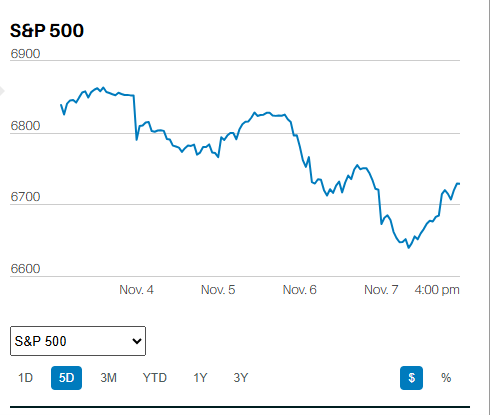
The S&P 500 rose 0.5% to finish the week at 4,308.50, breaking a four-week losing streak. The index is down 10.6% since it hit an all-time high of 4,818.62 on 4 Jan 2022. The S&P is down 6.5% since 27 July when it hit a 52-week high. It is up 12.2% year-to-date. Almost all the gains came from a handful of mega-cap stocks. The equally weighted S&P 500 index is down marginally on the year. The average stock is down as well.
Long-term interest rates are being blamed for the declining stock market. The 30-year Treasury briefly topped 5% last week. The 10-year Treasury hit 4.89% before closing the week at 4.80%. That’s up from 3.23% in March, a big move for 10-year Treasury yields in such a short time. 10-year Treasury inflation-protected securities yielded 2.58% on Thursday, according to Barron’s. The real yield has more than doubled since last May. It is the highest since the financial crisis peak in November of 2008. The real yield is the yield you receive minus inflation. It is the true cost of money.
Interest rates have been rising for several reasons. The Federal Reserve is shrinking its balance sheet, which means less bond buying. The Chinese economic recovery is weak. A lower trade surplus means less Treasury bond buying. The federal government is running large deficits which means more Treasury bond issuance. The strong U.S. economy means higher short-term rates for longer from the Fed. Higher short-term rates means less long bond buying from investors. Investors don't want to own the riskier long end when they can get 5% plus from safer short-term bonds.
In short, more supply and less demand for long-term Treasury bonds is pushing rates higher. Almost 73% of BMO Capital Markets clients expect the 10-year Treasury yield to hit 5%, according to Barron’s.

iShares 20+Year Treasury Bond ETF is in a downtrend and showing no signs of a turnaround. Price down equals yield up.
So how to explain the surging stock market on Friday? The S&P bottomed at 4,219.55 Friday morning in the first hour of trading. It closed 2.1% higher from its low, rising to 4,308.5. Meanwhile, the iShares 20+ Year Treasury Bond ETF (TLT) gapped down, sending its yield higher. It did start to recover almost immediately but still closed 1.21% lower on the day. The stock market’s behavior doesn’t jibe with the move in long-term interest rates. Higher yields should mean lower stock prices. Higher yields are why stocks have been falling since the S&P 500 peaked on 27 July after all.
The media threw out explanations that don’t quite make sense. It acknowledged that the jobs report Friday was stronger than expected. Nonfarm payrolls rose by 336,000, well above the expected 170,000. What’s more, revisions to the past two months’ reports saw an extra 119,000 jobs added. Barron’s pointed out that the “too-strong jobs data renewed the frenzy in the bond market, briefly sending the 30-year Treasury yield back above 5%.
How did Barron’s explain the surging stock market? It claimed that traders, “apparently took notice of a subdued rise in average hourly earnings of 0.2%”. It’s hard to imagine that stock traders decided marginally slower wage growth negated the rest of the strong jobs report. It’s telling that the bond market didn’t trade based on a “subdued” rise in average hourly earnings. Bonds sold off on the strong report. The bond market is usually right when the two markets diverge, as they did on Friday.
Okay, then why did the stock market surge higher on Friday? Trading based on technical analysis is likely the answer. The S&P held support above the 200-day moving average for four days in a row. The S&P bottomed at 4,216.45, 4,220.48, 4,225.91, and 4,219.55 Tuesday thru Friday. Support attracted buyers, shorts began to cover, and it was off to the races. Why does the reason matter? Because a technical rally is more likely to reverse in the coming week or two. The VIX peaked at 20.88 on Wednesday, well short of what it takes for a significant bottom to form. The VIX needs to rise above 30 before a more durable bottom is created. Options traders aren’t nearly scared enough yet for the selling to have been exhausted.
Currently, the short-term trend is down. The S&P peaked on 27 July at 4,607.07. It fell to 4,335.31 by 18 August, hit a lower high of 4,541.25 on 1 September, and then a lower low of 4,216.45 on 3 October. The S&P needs to rise above 4,541.25 to put an end to the short-term downtrend. Breaking above 4,541.25 wouldn’t establish an uptrend but would get us back to a sideways market.
Of course, fundamentals rule in the long run. It’s possible that the upcoming earnings season will provide fuel for a trend reversal. Earnings season starts this week. Third-quarter profits are expected to rise by 0.05% according to Barron’s. Ed Yardeni of Yardeni Research has consensus third-quarter profits falling by 0.2%. Let’s call earnings expectations flat for the third quarter.
Worse-than-expected earnings will likely accelerate the stock market lower. Better-than-expected earnings may halt the decline. It may not. The yield curve, a declining LEI, and rising credit card delinquencies, among other leading indicators, point to a weakening economy. A weakening economy means disappointing earnings. Perhaps not in the third quarter, but within the next couple of quarters. The current earnings growth forecast of 12% for 2024 is likely to disappoint. The short-term stock market trend is down. Long rates are rising. Leading indicators are pointing toward a weakening economy. Uncertainty is high and risk management remains a priority.
Economic Indicators
The jobs report dominated economic data last week. The 336,000 jobs created more than doubled the forecast of 170,000. The prior two months were revised up by a total of 119,000 as well. Initial jobless claims were a low 207,000, not much different from the prior week’s 205,000. Job openings surged to 9.6 million from 8.9 million. Job openings were well ahead of the 8.8 million estimate. The three-month and 12-month average rise in payrolls has been 266,000. Jobs growth needs to fall below 100,000 if unemployment is to rise above 4%. The Fed’s median projection is for unemployment of 4.1% by year-end 2024. Wage growth isn’t likely to fall to the 3% to 3.5% needed to bring inflation down to 2% unless unemployment rises above 4%. Wage growth of 4.2% year-over-year was reported last week.
Meanwhile, the ISM manufacturing index was 49.0% in September up from 47.6% the prior month. A number below 50 shows contraction. The ISM services index for September was 53.6% down from 54.5% the prior month. The ISM services index remains in growth mode. It has risen for 9 months in a row and 39 of the last 40 months. The business activity index is at 58.8%. The New Orders Index is at 51.8% while the employment index is at 53.4%. The Supplier Deliveries index is at 50.4%. Services represent over 80% of the economy. The economy won’t fall into recession unless the services sector does. Norwood Economics is expecting a recession by the second half of 2024 at the latest
Social Security and Retirement
I met with a prospect last week. Their spouse was leaving his job and hoping to work part-time somewhere else. He is 62 years old and was also planning on taking social security. His social security benefit at age 62 will be $1,824 monthly or $21,888 annually. He will receive $764 more per month if he waits to full retirement age (FRA), which is 67 for him. The extra benefit totals $9,168 per year. His annual compensation would be $31,056. He would receive $3,209 per month or an extra $621 per month if he waited until age 70. Breakeven for waiting until age 70 instead of taking the benefit at age 67 is 82 years of age. His annual compensation at age 62 is $21,888. His annual compensation if he waits until age 70 is $38,508.
Most people in good health in their mid-60s can expect to live into their 80s. His spouse would take over his larger payment if he died first. Social security is the best annuity in the world. It is backed by the full taxing power of the United States government. It also receives cost of living adjustments, unlike private annuities. It serves as longevity insurance as well. Longevity insurance provides an income when you’ve spent all your savings.
One other point about taking social security early if you plan on continuing to work. From the SSA.gov website:
You can get Social Security retirement or survivors benefits and work at the same time. But, if you’re younger than full retirement age, and earn more than certain amounts, your benefits will be reduced. The amount that your benefits are reduced isn’t lost. Your benefit will increase at your full retirement age to account for benefits withheld from earnings. If you’re younger than full retirement age during 2023, you’ll have $1 deducted from your benefits for each $2 earned above $21,240.
Something to be aware of if you decide to take social security early while continuing to work. Your social security benefit may be reduced, depending on how much you earn. Regardless, your best bet is almost always to wait until age 70 before taking social security if possible.
Regards,
Christopher R Norwood, CFA
Chief Market Strategist