Earnings estimates are too high.
[Norwood Economics is forecasting a recession within six to twelve months]
Market Update
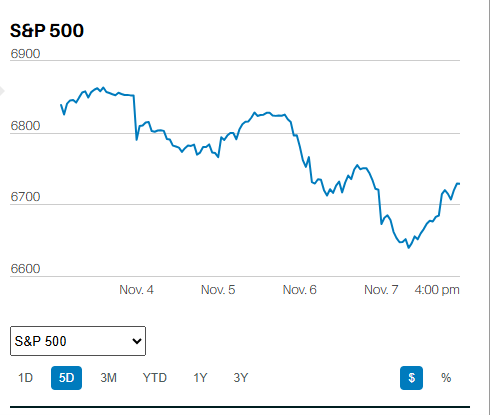
The S&P 500 gained 0.45% to finish the week at 4,327.78. The Nasdaq lost 0.18%. The 10-year Treasury finished the week yielding 4.63%. The 10-year Treasury yield peaked two weeks ago at 4.88%. The stock market trading was mechanical last week. Algorithms ruled the day. The same was true of bond market trading. What that means is that both stock and bond prices rose despite news that could have sent both lower. Oversold conditions trumped fundamentals.
The S&P rally started two Fridays ago when selling wasn’t heavy enough to breach the 200-day moving average. We wrote last week that the index, “bottomed at 4,216.45, 4,220.48, 4,225.91, and 4,219.55 Tuesday thru Friday.” The bounce that started two Fridays ago vaulted the S&P to resistance at 4,400 by Tuesday. The 100-day and 50-day moving averages are at 4,400. The index peaked at 4,385.46 Tuesday followed by highs of 4,378.64, 4,385.85, and 4,377.10 the following three days. The index was unable to break above resistance during the four-day assault on 4,400.
The S&P took one more run at resistance on Friday and peaked within the first 15 minutes of trading. It sold off, bottoming at 4,311.97 around 1:30 before bouncing into the close. An inability to break above resistance often leads to selling. Four days without progress was enough for the selling to overwhelm buying. Sellers locking in profits from the recent bounce threaten a retest of the 200-day at 4,220 this week.
Earnings season begins in earnest this week though and might influence trading. Positive earnings news could send stocks higher. Earnings news might even encourage buyers to try again for the 4,400 resistance. Negative news will see the market test support at 4,220. Stock market technicals favor the downside this week. Several technical indicators have rolled over. The S&P is no longer oversold. The short-term trend is still down.
The long bond bounced last week from an oversold condition. Prices rose (yields fell) after the RSI indicator bottomed at 20. An RSI below 30 marks an oversold condition. The iShare 20+ Treasury bond ETF (TLT) bottomed at 84.06 on 6 October. It jumped to 86.80 when the bond market reopened on Monday 9 October but ran into resistance on Wednesday. The TLT peaked at 88.47 on Wednesday, just under the 20-day moving average. The Tuesday 88.47 high was followed by highs of 88.19 and 87.83. The long bond is still in a downtrend. Price will need to move above the 20-day in the next few trading sessions. Otherwise, we’re likely to see a retest of the 6 October low. That low is also a 16-year low in price (16-year high in yields).
Of course, the media pointed at events last week to explain stock and bond price movements. Barron’s listed the Israeli-Hamas conflict as a factor. It mentioned a weak long-dated Treasury auction on Thursday. There was also stronger-than-expected inflation data making news on Thursday. Barron’s wrote that, “none of those were able to keep the stock market down this past week.”
We’re making the case that both stocks and bonds experienced oversold bounces. Barron’s is pointing at events that could easily have led to declines in both stocks and bonds. It matters because technical rallies fade fast. Rallies based on fundamentals are more durable. Stocks and bonds reversing lower this week would confirm that last week was nothing but an oversold bounce. The main trend for both stocks and bonds is down. Uncertainty remains high and risk management remains a priority.
Economic Indicators
The small business NFIB optimism index was 90.8 in September down from 91.3. Owners are pessimistic about future business conditions. “Sales growth among small businesses have slowed and the bottom line is being squeezed, according to Bill Dunkelberg, NFIB Chief Economist. Small business owners expecting better business conditions over the next six months deteriorated six points from August. The net negative 43% reading is at recession levels.
The PPI rose 0.5% in September, above a forecast of 0.3% but down from 0.7% last month. Core PPI rose 0.2% as expected. Core PPI year-over-year rose 2.8% down from 3.0%. PPI leads CPI. And CPI came in above expectations. CPI rose 0.4% in September, down from 0.6% the prior month but above the 0.3% forecast. Core CPI rose 0.3%, unchanged from the prior month and as expected. Core CPI is running 4.1% year-over-year down from 4.3%.
There is a 93.8% chance the Fed will hold the funds rate steady in November according to the CME FedWatch tool. There is a 69.6% chance the Fed will hold rates steady through year-end. The futures market is pricing in three rate cuts next year, starting in June. Earnings estimates are for 12% growth in 2024. The earnings growth and interest rate cut forecasts are at odds with one another. Earnings growth of 12% implies solid economic growth. It is unlikely that the Fed will begin cutting interest rates if the economy is still growing at trend. It is unlikely that wage growth will have cooled enough with the economy growing at trend to allow cuts. One of the forecasts is almost certainly wrong.
Norwood Economics believes the earnings growth forecast is too high. We are forecasting a recession within the next six to twelve months. The stock market is trading at 17.5x 2024 earnings. Not too expensive. But low or no earnings growth is more likely than 12% earnings growth. A recession is usually accompanied by negative earnings growth of 15% to 20%. Mike Wilson of Morgan Stanley is forecasting earnings of $228 per share in 2024. The S&P is trading at 19x Wilson’s earnings estimate, expensive in a no growth environment. The downside for the market if Wilson’s earnings estimate is accurate is around 4,000, or about 8% lower than now. The downside if we have a recession is the low 3,000s. S&P earnings of $200 with a 15 to 16 P/E puts the market at between 3,000 and 3,200. Major support would be the October 2022 low of 3,491.58. Not the end of the world, even if the S&P were to retrace its entire rally from the 13 October 2022 low. And it would be a wonderful buying opportunity!
A New Paradigm
The investment environment has changed dramatically. Maybe only for a short period but more likely for decades to come. Interest rates were extraordinarily low for 15 years. Negative interest rates became a thing. I’ll never forget auditing a macroeconomic class at Butler University five years or so ago. I was listening to the professor describe the zero boundary. It was thought impossible to have negative nominal interest rates. It said so right there in the textbook the professor was using. The problem? Around $15 trillion in government bonds worldwide were trading with negative interest rates at the time.
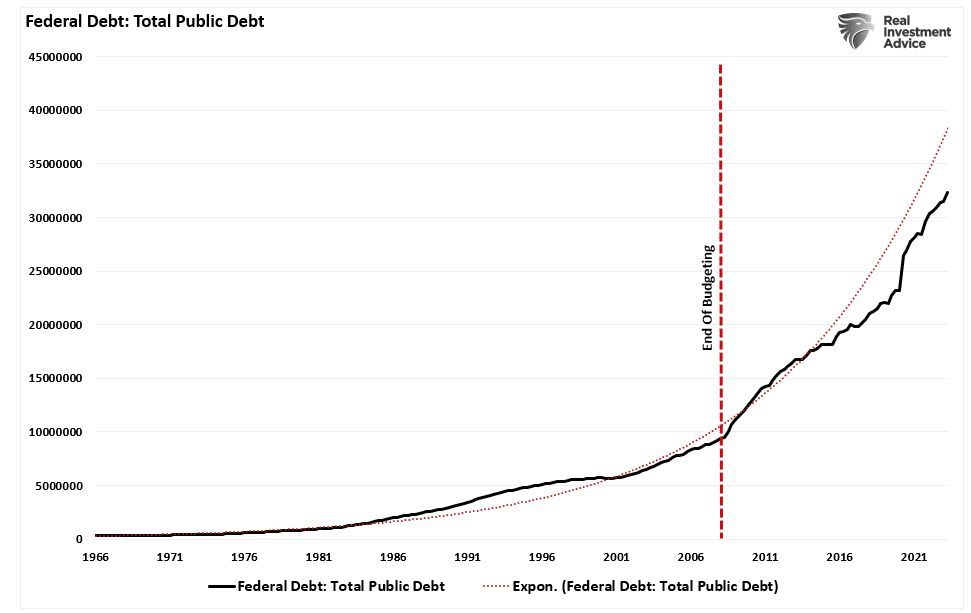
Those days are gone for now and perhaps forever. The U.S. 10-year is trading at 4.63%. The world is awash in debt. Governments need inflation to help whittle down the real debt burden. Fiscal stimulus is needed to keep economies choking on debt from falling into recession. Irving Fishers debt-deflationary spiral is an all too real possibility when debt gets too high. Fisher believed that debt and deflation destabilize one another. Instability arises because deflation causes financial distress. Financial distress is caused by the real debt burden rising as prices fall. Financial distress in turn generates more deflation. It is a central bank's worst nightmare.
It is the reason that the Federal Reserve is likely to stop raising rates before it should. And that is one of the reasons that inflation will stop falling before it gets below 2%. Large deficits are the other reason inflation isn’t likely to return to 2% anytime soon. The federal government is spending beyond its means to keep the economy growing. The deficit topped $2 trillion in the fiscal year 2023. The $2 trillion number excludes the impact of the student loan forgiveness program, according to Strategas Asset Management. (The Supreme Court recently struck down the forgiveness program as unconstitutional).
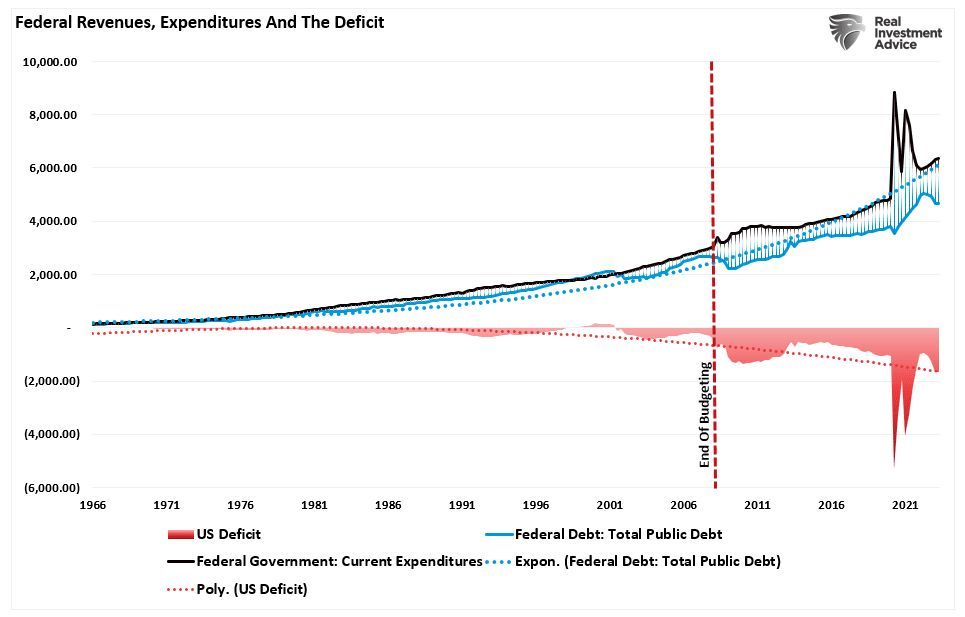
Treasury auction sizes are expected to increase by 24% in 2024. The next President will have a choice. He can seek fiscal austerity which will likely tank the economy. Or he can accept higher inflation and interest rates. Norwood Economics is betting on higher inflation and interest rates.
Washington needs and wants to spend. The Fed fears a debt-deflationary spiral. Forces are aligned for higher inflation for the foreseeable future. The Fed is likely to cut rates too soon and by too much. Inflation won't reach 2%, or at least not for long before climbing again.
Inflation is likely to run between 3% and 6% for the next decade or more. The 10-year Treasury is likely to trade with a yield between 3% and 7% for the foreseeable future. There might be brief periods where its yield moves above or below that range. But investors and the economy will need to adjust to higher rates and higher inflation. Asset allocation needs to take the new paradigm into account. What worked from 2008 until 2021 is not likely to work in the next decade.
Regards,
Christopher R Norwood, CFA
Chief Market Strategist