Stealth Indexing Increases Costs Without Reducing Risk.
Market Update
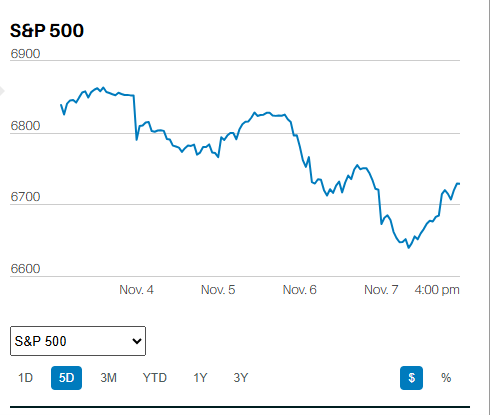
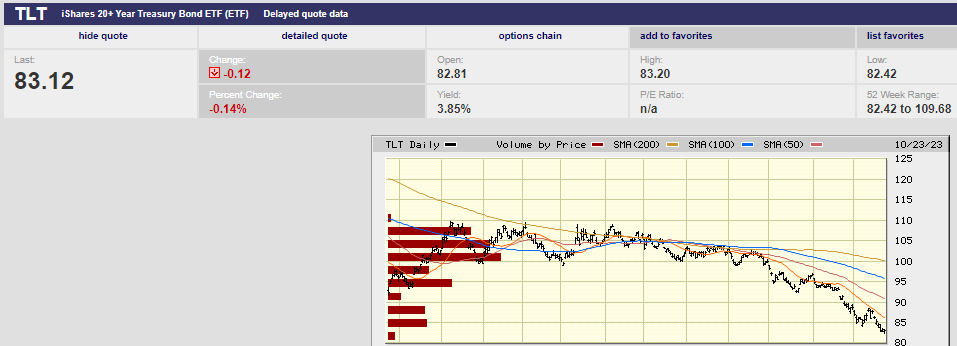
The S&P 500 fell 2.4% last week to finish at 4,224.16. The Nasdaq fell 3.2%. The 10-year Treasury yield ended the week at 4.91% while the 30-year Treasury yield closed out the week at 5.07%. Long bond yields continue to rise (prices fall). The oversold long-bond bounce that began on 6 October and peaked on 11 October is over. The iShares 20+ Treasury Bond ETF (TLT) hit lower lows four days in a row last week, bottoming at 82.74 on Thursday. The TLT avoided a fifth straight lower low on Friday, touching 82.77 early but holding above Thursday’s low. Still, the trend in long-bond prices is down.
Stocks will continue to struggle as long as interest rates continue rising. We wrote last week that the bounce in both stocks and bonds was likely nothing more than an oversold rally. That turned out to be the case. We further wrote that technical rallies fade fast, and this one did. Our expectation was that the stock market would test 4,220 on negative news. The negative news came in the form of Chairman Powell. He reiterated on Thursday that interest rates will stay higher for longer. The bond market was already pricing in higher rates in the days leading up to Powell's speech. Hearing the words from Powell merely reinforced the existing trend.
The S&P had four lower lows in a row last week. It touched 4,223.03 on Friday. Recall that the S&P had lows of 4,216.45, 4,220.48, 4,225.91, and 4,219.55 beginning on 3 October. Those lows occurred just above the 200-day moving average, which was acting as support.
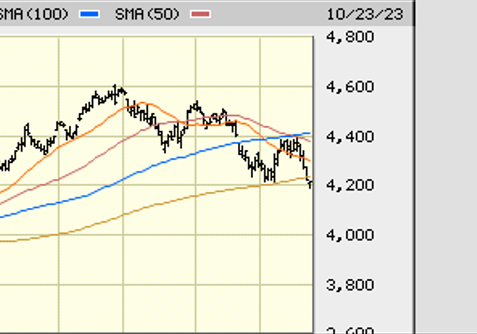
The index has roundtripped over the last 10 trading days. It closed below the 200-day moving average on Friday. The moving average was major support. It is now resistance. There is a possibility of an ugly opening on Monday. It will depend on the news over the weekend. Several technical indicators are flashing sell, notably the MACD and the slow stochastic. Expect more downside early in the week. It is the path of least resistance at the moment. There is good support at 4,200 and the market may hold above it, at least for now.
Earnings season has begun. Strong earnings reports from Microsoft, Alphabet (Google), and Amazon this week could rescue the market for the moment by triggering another short-term rally. A failure to regain the 200-day moving average this week could see selling accelerate. A move below 4,216.45 would mark another lower low in the downtrend that began on 27 July. Confirmation of the downtrend would increase the likelihood of a retracement to support between 3,800 and 4,100. The coming week should give us important clues about the stock market’s direction into year-end.
Long-term interest rates continue to rise. The stock market continues to fall. Uncertainty remains high and risk management remains a priority.
Economic Indicators
The consensus estimate for Q3 GDP is 4.5%, according to MarketWatch. The Atlanta Fed GDPNow is forecasting 5.4% for Q3 as of 18 October. The GDP report will be released on Thursday. Strong GDP growth will put upward pressure on long-term interest rates. The rise in the long bond over the last few weeks may be the bond market sniffing out a stronger-than-expected GDP report. Perhaps a number closer to the Atlanta Fed’s GDPNow report of 5.4% than the consensus estimate of 4.5%. Regardless, both numbers are strong and above trend. Sustainable GDP growth in the U.S. is estimated to be between 1.5% and 2.0%. Above trend growth strengthens the case for higher interest rates. It’s hard to imagine inflation continuing to trend lower with the economy growing well above trend. Even harder to imagine with the labor market as tight as it is. Core PCE comes out on Friday. The estimate is a rise of 0.3% in September, up from 0.1% the prior month. A high core PCE number on Friday following a strong GDP number on Thursday could send the stock and bond markets sharply lower.
James Kochan is a former fixed-income strategist at Merrill Lynch and Wells Fargo. He’s bearish on long bonds and believes the Fed will need to continue hiking the fed-funds rate to 6%. Kochan is channeling Jamie Dimon of JPMorgan . Dimon warned on January 10th, 2023, that the Fed “may very well” raise interest rates to 6%. He hasn’t retracted that point of view. The stock market isn’t pricing in long-bond interest rates of 6% to 7% yet. Higher than-expected long-term rates remain one of the major risks for investors. It doesn't help that Treasury auction sizes are increasing. Nor does it help that foreign central bank demand for Treasuries has fallen. Increasing supply and reduced demand means falling bond prices and rising yields.
The 10-year Treasury yield is 4.91%. The yield peaked at 5.30% in 2007, according to Evercore ISI. Meanwhile, stocks remain expensive. The twelve-month forward P/E is 17.1x 2024 earnings. It’s unlikely earnings will rise by 12% in 2024. It’s more likely we’ll see flat to falling earnings as the U.S. economy enters a recession.
The S&P 500 is expensive even if 12% earnings growth materializes. It's even more expensive if earnings growth is in the mid-single digits (or less). Ned Davis Research calculates the cash-adjusted P/E for the S&P 500 at 21.4x trailing earnings. The long-term average is 16.2 times. The cash adjustment removes earnings from cash parked in Treasuries. It’s an attempt to gauge a company’s operating earnings which are the earnings that count over the long run. Ned Davis Research calculates the operating P/E for the S&P at 20.2x versus a long-term average of 18.8x. Interest rates at 16-year highs with the S&P P/E above its long-term average means more risk.
Much depends on the economy continuing to grow above trend despite rising long-term rates. Unfortunately, rising rates reduce consumer and business spending. It’s unlikely the economy can produce double-digit earnings growth in 2024 if rates remain high.
Portfolio Management
Most investors are stealth indexing. Financial advisors encourage it. Investors feel safer because of it. They are not. Systemic risk can't be diversified away. Systemic risk is inherent to the entire market. Systemic risk is not reduced no matter how many positions you hold. Meanwhile, company-specific risk is completely diversifiable with as few as 40 stocks. Holding hundreds of extra positions doesn't reduce it any further. Investors are giving up the possibility of earning excess risk-adjusted returns by holding hundreds of positions. They are giving up the possibility and gaining nothing for it since risk isn’t reduced any further.
Norwood Economics frequently reviews portfolios for prospects. We see stealth indexing almost all the time. Stealth indexing gives the appearance of active management. Yet the hundreds of extra positions cancel one another out. The stealth index portfolio ends up matching the market minus fees and expenses.
For example, a UBS portfolio we reviewed held 125 positions, including 16 mutual funds. The mutual funds in turn held more than 1,000 stocks and bonds. The UBS portfolio will track the stock and bond markets minus fees and other expenses. Far cheaper to own index funds if the investor is content to earn the market rate of return. Importantly, the portfolio isn’t any safer for holding over 1,000 positions. Better to index and save on the expenses.
It takes only 15-25 stocks to diversify away 90% of company-specific risk. It takes only 40 stocks to completely diversify away company-specific risk. Systematic risk can’t be diversified. But a 40-stock portfolio has no more systematic risk than a 1,000-stock portfolio. Nor does a 40-stock portfolio have more company-specific risk than a 1,000-stock portfolio, if the portfolio is built with diversification in mind. Investors may feel safer owning 1,000 positions but they are not. And there are costs associated with holding hundreds of extra positions.
Rule number one of institutional investing is to know what you own. Rule two is to know how much you own. Rule three is to know why you own it. It’s much easier for a portfolio manager to follow the rules with a smaller number of holdings. Owning 1,000 positions that are constantly changing as mutual funds buy and sell makes it difficult to know what you own, how much you own, and why you own it.
Norwood Economics manages diversified portfolios of stocks, bonds, real estate, and gold. Our stock holdings include domestic and international companies. We gain emerging market exposure through the Vanguard Emerging Market Index ETF. We get exposure to bonds through various Vanguard bond index ETFs. Our portfolios are less risky because we diversify among asset classes. The S&P 500 lost 18.2% last year. It was down 27% at one point. The Nasdaq was down 32% last year. Our portfolio returns in 2022 ranged from down 3%-4% to up a percent or two depending on the portfolio. You don’t need to own 1,000 positions to be diversified.
Regards,
Christopher R Norwood, CFA
Chief Market Strategist